Utility of cardiopulmonary exercise test is unknown in patients with aortic stenosis. In this retrospective study, we examined the maximal indexes of cardiopulmonary testing at peak exercise in 155 consecutive patients with aortic valve area of ≤1.5 cm 2 who were referred for this test. The patients were passively followed up to assess their effect on the primary end point of all-cause mortality. We found that the absolute peak oxygen consumption (VO 2 ) was significantly reduced in these patients, with age and gender–predicted peak VO 2 of 80 ± 23%. Peak VO 2 was markedly reduced (<80% of predicted) in 54% of patients. During a follow-up of 5 ± 4 years, a total of 41 patients died, and 72 underwent aortic valve replacement. Survival was significantly better in patients with higher absolute peak VO 2 (hazard ratio [HR] 0.87, 95% confidence interval [CI] 0.80 to 0.93, p <0.001) and higher oxygen pulse (HR 0.80, 95% CI 0.74 to 0.9, p <0.001). In 83 patients who did not undergo valve replacement, higher peak VO 2 and oxygen pulse were associated with better survival (HR 0.83, 95% CI 0.71 to 0.97, p = 0.024 and HR 0.80, 95% CI 0.66 to 0.96, p = 0.02, respectively). In conclusion, the peak VO 2 is significantly reduced in patients with aortic stenosis. Higher peak VO 2 is independently associated with better survival in these patients irrespective of whether they undergo valve replacement.
Symptom-limited cardiopulmonary exercise testing (CPX) assists in differentiation of cardiac limitation from pulmonary or other limitation as a cause of exercise-induced symptoms. CPX has a definite role in risk stratification in patients with coronary artery disease, heart failure, and hypertrophic cardiomyopathy but has been underused for risk assessment in patients with aortic stenosis (AS). Current guidelines recommend valve replacement in symptomatic patients with severe AS. However, some patients who claim to be asymptomatic may have limited their physical activity to avoid symptoms. Additionally, many patients, especially elderly, have mild or equivocal symptoms that are difficult to distinguish from effects of aging, deconditioning, or obesity. CPX with determination of gas exchange provides quantitative, objective, and noninvasive evaluation of cardiopulmonary fitness and estimate of cardiac output. To our knowledge, there are very few studies that have systematically examined the clinical and prognostic utility of CPX in patients with AS. In the present study, we examined the indexes of CPX at peak exercise and assessed their association with mortality.
Methods
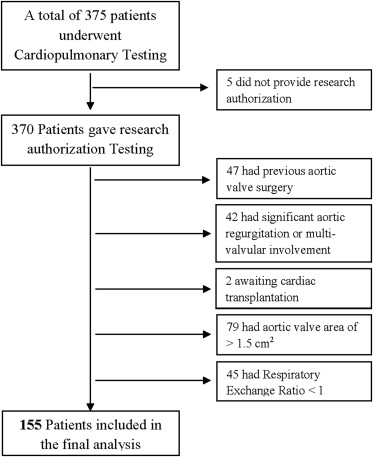
From 1994 to 2009, a total of 375 patients with the diagnosis of AS were referred for CPX to our Cardiopulmonary Exercise Testing Laboratory at Mayo Clinic, Rochester. We excluded patients with previous aortic valve (AV) surgery, moderate to severe aortic regurgitation, significant multivalvular involvement, AV area of >1.5 cm 2 on echocardiographic assessment, systolic heart failure, and the patients who gave submaximal efforts during exercise indicated by respiratory exchange ratio of ≤1. Five additional patients were excluded because they denied access to their medical records. Thus, the final study population ( Figure 1 ) consisted of 155 patients with moderate to severe AS according to the current classification scheme. The study was approved by the Mayo Clinic Institutional Review Board.
Baseline characteristics of the population were recorded on the day of CPX. This included their heart rate at rest, blood pressure, body mass index, electrocardiogram, history of previous cardiac surgery, medication use, and co-morbidities including presence of coronary artery disease, hypertension, diabetes, and dyslipidemia. A physician (PC) performed the detailed chart review of the subjects for symptoms. To validate this abstracting procedure, a second physician (AD) reabstracted this information on a random sample of 15 patients (∼10%). The interrater agreement on the abstracted data was 100%.
Each patient underwent a symptom-limited maximal CPX with respiratory gas exchange analysis using an accelerated Naughton protocol as previously described (2-minute workloads, 2 METs/min increments in work). Patients were encouraged to exercise to exhaustion and were discouraged from holding on to the handrails. Exercise duration is expressed in minutes and in percentage of age and gender–predicted value. Breath-by-breath minute ventilation, carbon dioxide production (VCO 2 ), and oxygen consumption (VO 2 ) were measured using a Medical Graphics metabolic cart (St. Paul, Minnesota). Peak VO 2 was the highest averaged 30-second VO 2 during exercise and is expressed as absolute peak VO 2 . The oxygen pulse, an estimate of stroke volume, was calculated as VO 2 /heart rate. Quality of exercise effort was assessed by respiratory exchange ratio, which is calculated using the formula VCO 2 /VO 2 . A certified exercise specialist supervised the test with a physician always available in the laboratory in case of an emergency. Patients were questioned for symptoms at every stage of the test, and the test was stopped either because of symptoms or positive high-risk features on the test, including a decrease in systolic blood pressure of >20 mm Hg with increasing workload, high-risk ST changes, and sustained ventricular arrhythmia.
The 155 subjects underwent a comprehensive 2-dimensional and Doppler echocardiographic evaluation within 3 months of CPX, with a mean of 6 ± 23 days. The left ventricular ejection fraction, peak velocity, peak and mean pressure gradients across the AV were recorded using standard technique. The AV area was calculated using continuity equation.
The primary end point of this study was all-cause mortality. Patients were followed up for 5.1 ± 4.2 years (maximum 16) to record these events. Vital status of all subjects was determined using Mayo Clinic registration database, as described elsewhere, and Accurint (an institutionally approved web-based resource and location service). Surgical procedures were ascertained through surgical data retrieval system using a medical record linkage system, confirmed by manual chart abstraction.
All analyses were performed using the Statistical Package for Social Sciences 16 (SPSS, Inc., Chicago, Illinois) and Statistical Analysis System, version 9.1 (SAS Institute Inc., Cary, North Carolina). Descriptive statistics were computed as mean ± SD for continuous variables and as frequency for categorical variables. Peak VO 2 was analyzed using absolute values in milliliter per kilogram per minute and percent predicted for respective age and gender. The Wilcoxon rank sum test was used for comparisons of continuous variables, and chi-square test was used for comparisons of categorical variables. Correlation of peak VO 2 with AV area, peak velocity, and mean transvalvular gradient were assessed using linear regression. Outcome was analyzed using end point of all-cause mortality. Cox proportional hazards regression was used to test for an independent association among baseline demographic factors, clinical characteristics, peak VO 2 , and end points of interest. A value of p ≤0.05 was considered statistically significant for meaningful difference. Event rates were estimated and survival curves were obtained using Kaplan-Meier method and compared between groups using the log-rank test.
Results
A total of 155 patients (69.6 ± 10.7 years, 90% men) with AV area of ≤1.5 cm 2 who completed CPX with maximal efforts were included in the final analysis. Main demographic, clinical, and echocardiographic characteristics are presented in Table 1 , which also illustrates the differences in these characteristics in patients with moderate and severe AS. Almost 1/2 of the patients reported minimal equivocal symptoms, primarily fatigue and musculoskeletal symptoms, which could not be explained on the basis of underlying AS alone. Follow-up was obtained for all the patients.
| Variable | Total (n = 155) | AV Area <1 cm 2 (n = 76) | AV Area 1–1.5 cm 2 (n = 79) | p Value ∗ |
|---|---|---|---|---|
| Age (yrs) | 69.6 ± 10.7 | 70.2 ± 10.3 | 69.1 ± 11.2 | 0.78 |
| Men | 139 (90) | 65 (86) | 74 (94) | 0.09 |
| Body mass index (kg/m 2 ) | 29 ± 5.2 | 27.8 ± 4.5 | 30.2 ± 5.5 | 0.73 |
| Current smokers | 10 (6) | 6 (8) | 4 (5) | 0.51 |
| Previous smokers | 74 (48) | 33 (43) | 41 (52) | 0.48 |
| Diabetes mellitus | 22 (14) | 10 (13) | 12 (15) | 0.71 |
| Known coronary artery disease | 58 (37) | 30 (40) | 28 (35) | 0.60 |
| Previous myocardial infarction | 21 (13) | 11 (15) | 10 (13) | 0.74 |
| Previous revascularization | 27 (17) | 14 (18) | 13 (17) | 0.74 |
| Atrial fibrillation | 13 (8) | 6 (8) | 7 (9) | 0.82 |
| Peripheral vascular disease | 24 (15) | 12 (16) | 12 (15) | 0.92 |
| Stroke | 22 (14) | 12 (16) | 10 (13) | 0.57 |
| Lung disease | 15 (10) | 7 (9) | 8 (10) | 0.84 |
| No symptoms | 78 (50) | 47 (62) | 31 (39) | 0.03 |
| Equivocal/minimal symptoms | 77 (50) | 29 (38) | 48 (61) | 0.01 |
| β Blockers | 66 (43) | 25 (33) | 41 (52) | 0.02 |
| Calcium channel antagonist | 38 (24) | 18 (24) | 20 (25) | 0.81 |
| Bicuspid AV | 26 (17) | 13 (17) | 13 (17) | 0.96 |
| AV area (cm 2 ) | 1.03 ± 0.2 | 0.9 ± 0.1 | 1.2 ± 0.1 | <0.01 |
| Mean gradient (mm Hg) | 40.9 ± 14.1 | 46.8 ± 13.6 | 35.3 ± 12.1 | <0.01 |
| Aortic jet velocity (m/s) | 4.1 ± 0.7 | 4.4 ± 0.6 | 3.8 ± 0.6 | <0.01 |
| Left ventricular ejection fraction | 0.6 ± 0.1 | 0.6 ± 0.1 | 0.6 ± 0.1 | 0.51 |
∗ Comparing between groups with AV area of <1 and 1 to 1.5 cm 2 .
Cardiopulmonary responses to exercise, including heart rate at rest and peak heart rate, blood pressure, and exercise duration are listed in Table 2 . Mean respiratory exchange ratio was 1.15 ± 0.07, confirming appropriate efforts in most patients. We have also reported baseline characteristics according to the levels of peak VO 2 in Table 3 . Absolute peak and age and gender–predicted percent peak VO 2 showed no correlation to AV area, mean transvalvular gradient, and peak velocity.
| Variable | Total (n = 155) | AV Area <1 cm 2 (n = 76) | AV Area 1–1.5 cm 2 (n = 79) | p Value ∗ |
|---|---|---|---|---|
| Heart rate at rest (beats/min) | 73.5 ± 14.4 | 74.7 ± 13.7 | 72.3 ± 15 | 0.302 |
| Systolic blood pressure at rest (mm Hg) | 125.5 ± 19.7 | 124.8 ± 19.9 | 126.1 ± 19.7 | 0.698 |
| Diastolic blood pressure at rest (mm Hg) | 72.6 ± 11 | 73.1 ± 13 | 72.2 ± 10 | 0.637 |
| Peak heart rate (beats/min) | 130.7 ± 26.2 | 133.8 ± 25.2 | 127.7 ± 26.9 | 0.150 |
| Peak systolic blood pressure (mm Hg) | 150.2 ± 29.1 | 146.3 ± 27.3 | 153.8 ± 30.5 | 0.110 |
| Peak diastolic blood pressure (mm Hg) | 80 ± 18.2 | 71.6 ± 19.5 | 70.3 ± 16 | 0.658 |
| Exercise duration (minutes) | 7.2 ± 2.3 | 7.4 ± 2.4 | 7.1 ± 2.3 | 0.474 |
| Ischemic electrocardiographic changes | 35 (23) | 18 (24) | 17 (22) | 0.898 |
| Respiratory exchange ratio | 1.15 ± 0.07 | 1.13 ± 0.07 | 1.16 ± 0.08 | 0.06 |
| Peak VO 2 (ml/kg/min) | 19.6 ± 6.5 | 19.9 ± 6.7 | 19.3 ± 6.3 | 0.543 |
| Percent-predicted VO 2 | 80.6 ± 23.5 | 83.5 ± 25.1 | 77.9 ± 21.8 | 0.138 |
| VE/VCO 2 | 34.2 ± 6.7 | 34.7 ± 7 | 33.7 ± 6.3 | 0.337 |
| Oxygen pulse (ml/beat) | 13.1 ± 3.8 | 12.2 ± 3.3 | 14.1 ± 4 | 0.001 |
∗ Comparing between groups with AV area of <1 and 1 to 1.5 cm 2 .
| Variable | Total (n = 155) | Peak VO 2 ≥80% (n = 82) | Peak VO 2 <80% (n = 73) | p Value ∗ |
|---|---|---|---|---|
| Body mass index (kg/m 2 ) | 29 ± 5.1 | 27.3 ± 4.6 | 30.9 ± 5.1 | 0.42 |
| Current smokers | 10 (6) | 5 (6) | 5 (6) | 0.90 |
| Previous smokers | 74 (48) | 30 (41) | 44 (59) | 0.02 |
| Known coronary artery disease | 58 (37) | 19 (33) | 39 (67) | <0.01 |
| Atrial fibrillation | 13 (8) | 3 (23) | 10 (77) | 0.02 |
| Peripheral vascular disease | 24 (15) | 10 (42) | 14 (58) | 0.16 |
| Stroke | 22 (14) | 6 (27) | 16 (73) | <0.01 |
| Lung disease | 15 (10) | 2 (13) | 13 (87) | <0.01 |
| Equivocal/minimal symptoms | 77 (50) | 33 (43) | 44 (57) | 0.01 |
| β Blockers | 66 (43) | 30 (45) | 36 (55) | 0.07 |
| Calcium channel antagonist | 38 (24) | 13 (34) | 25 (66) | <0.01 |
| AV area (cm 2 ) | 1 ± 0.2 | 1 ± 0.2 | 1 ± 0.2 | 0.35 |
| Mean gradient (mm Hg) | 40 ± 14.1 | 42.6 ± 13.4 | 39 ± 14.6 | 0.38 |
| Left ventricular ejection fraction | 0.61 ± 0.11 | 0.63 ± 0.9 | 0.58 ± 0.1 | 0.65 |
∗ Comparing between groups with peak VO 2 of <80% and ≥80% of age and gender–predicted.
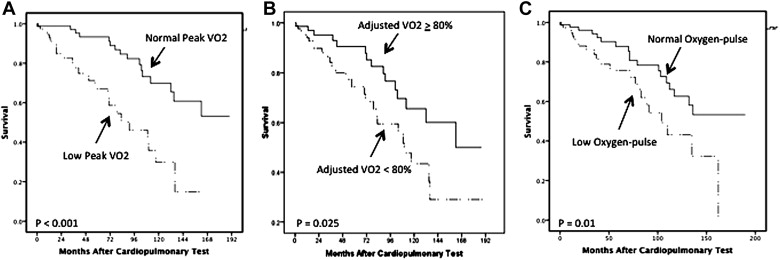
During follow-up of 5.1 ± 4.2 years, a total of 41 patients died, and 72 patients underwent aortic valve replacement (AVR). Mean time to death and AVR were 5 ± 3.7 years and 1 ± 1.5 years, respectively. After adjusting for age, gender, symptom status, Charlson index (an index of burden of co-morbid conditions), and AV area, survival was significantly better in patients with higher absolute peak VO 2 (hazard ratio [HR] 0.87, 95% confidence interval [CI] 0.80 to 0.93, p <0.001). The results using percent-predicted age and gender–adjusted peak VO 2 were essentially identical to these results. Similarly, higher oxygen pulse was associated with improved survival (HR 0.80, 95% CI 0.74 to 0.9, p <0.001). Kaplan-Meier survival curves after dividing patients based on absolute peak VO 2 cutoff of 19 ml/kg/min for men and 15 ml/kg/min for women, age and gender–adjusted peak VO 2 of ≥80% or <80%, and oxygen pulse cutoff of 13 ml/beat for men and 11 ml/beat for women are shown in Figure 2 . Absolute peak VO 2 cut-off values of ≥19 ml/kg/min for men and ≥15 ml/kg/min for women and oxygen pulse cut-off values of ≥13 ml/beat for men and ≥11 ml/beat for women were used based on previously reported normal values, which also approximately dichotomize the cohort.
Stay updated, free articles. Join our Telegram channel

Full access? Get Clinical Tree


