Fig. 11.1
The earliest known CPET was at the Harvard Fatigue Lab in the 1920s
Currently, CPET is subdivided into noninvasive testing (niCPET), done with continuous 12-lead ECG, cuff blood pressure monitoring and pulse oximetry, and invasive CPET (iCPET), which adds arterial and pulmonary artery catheters for blood gas, pH and pressure measurements. CPET may be used alone or combined with other modalities, such as transthoracic cardiac Doppler echo and MRI. There is a rapidly growing body of evidence supporting its utility in patients with suspected or confirmed PH. Recent expert consensus statements suggest CPET’s is useful in the diagnosis, management and risk stratification of PH [15, 16]. CPET is safe even in established PH [17, 18] Severe PH with exertional syncopal episodes, cardiac arrhythmias, or acute right ventricular failure do, however, serve as contraindications to maximum exercise testing [13].
Noninvasive CPET
niCPET can be used as a screening test in the patient with unexplained exertional intolerance [14, 19] where a significant percentage of patients will ultimately be shown to have PH [7]. Such patients have generally undergone a time-honored history, physical examination, routine blood work, which are normal or, in the eyes of the clinician, show abnormalities insufficiently severe to explain symptoms. niCPET may also be appropriate in suspected PH, e.g., family members of Group 1 PH, or in “at risk” patients with for example connective tissue disease [20].
niCPET can quantify the degree of exercise impairment, rule in or out a pulmonary mechanical limit to exercise and suggest disorders manifested by abnormal O2 delivery or subsequent uptake and utilization, including PH. niCPET variables that are useful in assessing the presence and severity of PH are shown in Table 11.1. These variables largely reflect PH-related impairment of O2 delivery to the exercising muscle bed and ventilation-perfusion abnormalities in the lung [17, 21–25]. Additionally, niCPEt allows reproducible assessment of functional capacity and treatment efficacy in PH and can predict survival [11, 17, 22, 26–28].
Table 11.1
Variables in niCPET useful in the assessment of PH
Maximum oxygen uptake |
Ventilatory or gas exchange anaerobic threshold (AT) |
Ventilatory reserve |
Ventilatory efficiency |
Arterial O2 desaturation |
PETCO2 change |
Exercise oscillatory ventilation |
Oxygen uptake efficiency slope |
Maximum Oxygen Uptake (VO2max)
Overall fitness is generally assessed by the VO2max, expressed as a percent of predicted for the patient’s age, gender and estimate of lean body mass, derived from height [29] VO2 increases linearly vs. work rate with a slope of approximately 10 mL/min/W in normal subjects [29]. This slope is not affected by age, gender, or training, but is shifted leftward in obese patients and may plateau in more severe heart failure (HF). In the obese patient, in the absence of pulmonary vascular disease, the VO2 max may be surprisingly well-preserved, but the external work performed on the cycle ergometer is compromised. This results from the oxygen cost of moving heavy legs or respiratory muscle work.
In established PH, VO2max decreases [7, 17, 23–25, 28, 30, 31]. Even milder exercise-induced PH depresses VO2max compared to normal [7, 10]. VO2max correlates inversely with resting pulmonary hemodynamics [17] and may improve with pulmonary vasodilator therapy [27, 32], but this is not uniformly observed [21], perhaps in part because of methodological concerns, but perhaps related to confounding deleterious effects of treatment.
Ventilatory (VAT) or Gas Exchange “Anaerobic” Threshold (AT)
Heavy exercise increases blood lactate concentration, ventilation and VCO2 relative to VO2; the latter can be reliably detected noninvasively with CPET using an iterative least residual sum of the squares of a two-segment log–log plot [35]. For many years the lactic acidemia of exercise was assumed to be secondary to inadequate oxygen delivery to muscle with resultant increases in “anaerobic” glycolysis to produce ATP. However, skeletal muscle mitochondrial redox state is actually higher when working muscle is producing lactate than at rest, implying that oxygen supply is not the critical factor [36–38]. Likewise, the tight mechanistic link between LT and VAT has been under mined by the fact that the two may be uncoupled experimentally [39–41] and in McArdle’s disease [42] where ventilatory patterns during incremental exercise are normal in the absence of lactic acidemia. Nonetheless, the AT varies with cardiovascular fitness, correlates well with human performance in the field, and remains a useful clinical index.
Ventilatory Reserve
Minute ventilation (VE) normally rises during incremental exercise as a result of a linear increase in breathing frequency and a hyperbolic increase in tidal volume (VT) [45]. VT reaches a plateau at approximately 50 % of the resting vital capacity, above which the elastic work of breathing is prohibitive [46]. The ratio of VE at peak exercise (VEmax) to the maximal voluntary ventilation (MVV) at rest has been termed the breathing reserve index [47]. A breathing reserve index of 0.70 can be sustained for 15 min in normal individuals, but values above 0.75 are usually not attained even at peak exercise [48].
Ventilation in patients with Group 1 PH may be excessive [49], but because the maximum voluntary ventilation is usually near-normal, relatively normal breathing reserve at peak exercise is usually found [17]. The niCPET can rule out a pulmonary mechanical limit to exercise by comparing VEmax to MVV. This is especially important in Group 3 PH where there are both pulmonary vascular and mechanical abnormalities limiting exercise. When an abnormal VAT precedes a BRI of 0.70, pulmonary vascular disease likely limits the patient’s activities of daily living. Conversely, when a BRI of 0.70 precedes the AT, pulmonary mechanics are thought to be rate limiting.
Ventilatory Efficiency
Normally, CO2 elimination by the lungs becomes more efficient during exercise [50]. Anatomic dead space increases because of a tethering effect on conducting airways at high VT. Conversely, during upright exercise, alveolar dead space decreases because of augmented blood flow to the lung apices, giving the net effect of a slight increase in total (physiologic) dead space (VD). However, this effect is more than offset by the increased VT, which produces a decrease in upright VD/VT from 0.45 at rest to less than 0.29 at maximum exercise [50]. Normally, the VE/VCO2 falls as a result to <37 at the ventilatory threshold [17].
Ventilatory inefficiency is one of the hallmarks of PH during exercise [7, 17, 23–25, 28, 30, 31, 51] and can be identified by an increased slope of the linear phase of VE/VCO2 or its absolute value at the ventilatory threshold. It has been suggested that the latter is preferable as the slope may be artificially flattened by hyperventilation at rest in anticipation of exercise.
A high VE/VCO2 during the submaximum domain of incremental exercise is explained by the alveolar ventilation equation:
 . [17]
Hyperventilation during low-level exercise is common in PH and usually ascribed to a combination of stretch receptors in the RV and pulmonary outflow track, J receptor stimulation (in HF and interstitial lung disease) and hypoxemic stimulation of arterial chemoreceptors [52]. In addition, alveolar dead space fails to fall normally [17, 53, 54] because of blunted pulmonary vascular distention and recruitment, and, perhaps, pulmonary vasospasm [55].
Thus, the combined influence of two invasively measured variables, VD/VT and PaCO2 may make the noninvasive VE/VCO2 a powerful marker of the abnormal pulmonary vasculature. Using a stepwise regression model using PaCO2 and VD/VT at anaerobic threshold as independent variables suggested that variability in VE/VCO2 at anaerobic threshold was accounted for equally by both. In HFrEF we have demonstrated equal contributions of VD/VT and hyperventilation to ventilatory efficiency [56].
Reybrouck et al. [54] found that the VE/VCO2 slope was steeper in patients with PH than the slope in patients with normal mPAP, and a significant correlation between the slope and mPAP and the VD/VT. In PH, VE/VCO2 is inversely related to peak cardiac output [55], resting [17], and exercise [57] mPAP’s and overall exercise capacity [54, 58] A sudden rise may suggest dynamic opening of a PFO and right to left shunting during exercise [23].
Ventilatory inefficiency can predict adverse events [59] and is likely a better predictor of survival than VO2max [22, 34, 60]. Recent work suggests [60] ventilatory equivalent for carbon dioxide at anaerobic threshold >55 identifies patients with an over sevenfold increased risk of death within 24 months and better predicted the clinical outcome compared to VO2max < 10.4 ml/min/kg.
Ventilatory efficiency improves after therapy, including pulmonary vasodilators [27, 61] and lung transplantation [49] Interestingly VE/VCO2 slope’s change after treatment does not appear to influence survival [62].
Arterial O2 Desaturation
In the normal human during incremental exercise, arterial O2 saturation remains normal and the A-aDO2 widens due to hyperventilation and a rise in the RER. In PH, arterial O2 desaturation and/or exaggerated widening of the P(A − a)O2 is due both to V/Q mismatching and a diffusion defect induced by a rapid red cell transit time through a poorly compliant and recruitable pulmonary circulation. Prevalence of arterial O2 desaturation with exercise increases with PH severity [28].
Occasionally, a sudden fall in arterial oxygen saturation heralds the opening of a patent foramen ovale and increased right to left shunting due to elevation of right atrial pressure [23].
Exercise arterial O2 desaturation is not generally a feature of ambulatory HFpEF or HFrEF. Recent work suggests severe O2 desaturation is a negative prognosticator for PH [63].
End Tidal PCO2 (PETCO2)
The PETCO2 normally rises at the AT, reflecting increased VCO2 delivered to the pulmonary capillary which is disproportionately “sampled” at lower end-expiratory lung volumes. The negative Pa-ETCO2 gradient is dependent on normal exercise induced pulmonary vascular recruitment and distension.
As with ventilatory efficiency, pulmonary vascular remodeling or dysfunction impairs this response and alveolar dead space fails to fall normally, diluting the end tidal breath with room air [24, 64]. When PETCO2 at AT is <30 mmHg and especially <20 mmHg, in a patient with exertional dyspnea of unknown cause, PH should be considered as likely.
It has been shown that the PETCO2 [28] transition from rest to AT can distinguish between PH and left ventricular dysfunction; PETCO2 tends to decrease in PAH, whereas the PETCO2 tends to increase in LVD [20, 64].
O2 Uptake Efficiency Slope (OUES)
In 1996, Baba et al. proposed a hybrid measurement of oxygen transport and ventilation during exercise as a surrogate for VO2max in the pediatric population in whom the latter was difficult to reliably achieve [66]. The OUES is an objective, reproducible measure of cardiopulmonary reserve that does not require a maximal exercise effort. It integrates cardiovascular, musculoskeletal and respiratory function into a single index that is largely influenced by pulmonary dead space ventilation and exercise-induced lactic acidosis.
The OUES is derived from the relation between oxygen uptake (V.O2 [ml/min]) and minute ventilation (V.E [l/min]) during incremental exercise and is determined by:
Major factors that influence the OUES are: CO2 output (derived from muscle aerobic metabolism as well as from the pH buffering function of bicarbonate), arterial pCO2 set-point, and VD/VT.
Exercise Oscillatory Ventilation (EOV)
Cyclic fluctuations in minute ventilation during exercise, called exercise oscillatory ventilation (EOV), have been observed in 19–51 % of patients with HF [70–75]. Exercise oscillatory ventilation is a noninvasive parameter that is easily measurable (Fig. 11.3) during submaximum exercise.
Fig. 11.3
Exercise oscillatory ventilation defined as ≥3 cyclic fluctuations of minute ventilation (V.E) during exercise with an amplitude >25 % of the mean trough-to-trough V.E during that interval. CL cycle length; Amp amplitude [76]
We recently examined iCPET data for EOV in 56 patients with HFrEF (mean ± SEM age, 59 ± 2 years; left ventricular ejection fraction, 30 ± 1 %) and 19 age-matched control subjects were studied with incremental cardiopulmonary exercise testing. We detected EOV in 45 % of HF (HF + EOV) patients and in none of the control subjects. The HF + EOV group did not differ from the HF patients without EOV (HF − EOV) in age, sex, body mass index, left ventricular ejection fraction, or origin of HF. Univariate predictors of the presence of EOV in HF, among measurements performed during exercise, included higher right atrial pressure and pulmonary capillary wedge pressure and lower cardiac index (CI) but not PACO2 or PAO2. Multivariate logistic regression identified that low exercise CI is the strongest predictor of EOV (odds ratio, 1.39 for each 1.0-L/min/m2 decrement in CI; 95 % confidence interval, 1.14–1.70; P = 0.001). Among HF patients with EOV, exercise CI was inversely related to EOV cycle length (R = −0.71) and amplitude (R = −0.60; both P < 0.001). In 11 HF + EOV subjects treated with 12 weeks of sildenafil, EOV cycle length and amplitude decreased proportionately to increases in CI. We conclude EOV is closely related to reduced CI, elevated filling pressures and impaired RV contractility (Fig. 11.4) during exercise and may be an important surrogate for exercise-induced hemodynamic impairment in HF patients.
Fig. 11.4
Correlations between exercise oscillatory ventilation (EOV) parameters and cardiac performance; EOV amplitude is inversely related to cumulative cardiac index during exercise (Σcardiac index; a) and right ventricular ejection fraction (RVEF; c). In addition, EOV cycle length is inversely related to cumulative cardiac index during exercise (b) and RVEF (d)
Noninvasive CPET Diagnostic Algorithms for PH
When used together, patterns of CPET variable changes may increase sensitivity and specificity of exercise testing for the diagnosis of PH [78–81]. Our laboratory validated a classic noninvasive CPET diagnostic algorithm for PH in a population of unexplained dyspnea with direct central hemodynamic measurements [26]. We evaluated 130 consecutive, clinically indicated iCPET’s whose phenotyping (see below) was performed to determine if PH were present at maximum exercise and limited exercise tolerance (pulmonary vascular limit (PVL) defined as a PVRmax >120 dyn s cm−5 and a maximum systemic oxygen delivery (DO2max) <80 % of predicted, in the absence of limiting abnormal pulmonary mechanics or poor effort). We evaluated the accuracy of a published diagnostic algorithm [78] (Fig. 11.5) and sequentially altered branch-point threshold values to maximize accuracy in diagnosing PVL. We based threshold values used at each branch point on the 95 % confidence intervals for healthy individuals during exercise [78]. Thus, for the diagnosis of PVL, branch-point values were adjusted in the following order: % predicted VO2max, anaerobic threshold as % predicted VO2max, breathing reserve maximum, and VE/VCO2 and anaerobic threshold.
Fig. 11.5
A popular noninvasive CPET diagnostic algorithm with key branch points for PH in bold
Figure 11.6 shows the changing sensitivity, specificity, and accuracy for PVL when a representative branch point (VE/VCO2 at anaerobic threshold) was altered systematically. If consecutive branch-point values resulted in identical accuracy, we chose the median value.
Fig. 11.6
Improvement of accuracy of a noninvasive CPET diagnostic algorithm by adjusting a key branch point (VE/VCO2) cutoff value
In an identical fashion, we determined the utility of isolated peak exercise measurements of VD/V ̇T and PA-aO2 for PVL. We used upper limit of normal values for peak exercise VD/VT and PA-aO2 of 0.28 and 35 mmHg, respectively [78].
The sensitivity of the isolated peak exercise VD/VT for PVL was 20 %, with specificity of 85 % and accuracy of 56 %. Similarly, the isolated peak exercise PA-aO2 had sensitivity for PVL of 24 %, specificity of 92 %, and accuracy of 60 %.
The noninvasive algorithm’s sensitivity for PVL was 79 %, specificity was 75 %, and accuracy was 76 % (n = 93). Systematic alteration of branch-point values improved the algorithm’s specificity and accuracy to 88 % and 85 %, respectively. The greatest improvement in sensitivity for detecting pulmonary vascular limit resulted from a decrease in the threshold value for VE/VCO2 at anaerobic threshold; we applied a stepwise linear regression model to this branch point. When PaCO2 and VD/VT at anaerobic threshold were denoted as independent variables, the model assigned equal weight to both (standard coefficients = 0.59 and 0.57, respectively, p < 0.0001).
A recent study by [20] confirms the utility of a niCPEt algorithm for early detection of pulmonary vascular disease in an at risk population. The authors further suggest that one can distinguish right from left sided disease by the addition of PETCO2 changes from rest to AT.
A suggested niCPET for the diagnosis of PH is suggested (Fig. 11.7).
Fig. 11.7
A suggested noninvasive CPET diagnostic algorithm. PH may be suggested by a decreased VO2max, early AT, ventilatory efficiency and decreased PETCO2’s
In summary, niCPET is a useful diagnostic modality that can suggest early or mild PH in at-risk patients or those with unexplained exertional intolerance. Confirmation of PH is almost always necessary through right heart catheterization. The remainder of this chapter focuses on combining CPET with RHC hemodynamic measurements.
Invasive CPET
Measurement of central hemodynamics during exercise has been performed for many years [82–84], but only more recently combined with CPET [85]. In our hands, an iCPET refers to niCPET with the addition of pulmonary and radial artery catheters for pressure measurements and blood sampling.
Methods
A detailed description of methods utilized in the BWH Advanced Cardiopulmonary Exercise Testing Facility has recently been published [86].
iCPET (Fig. 11.8) is best performed using a cycle ergometer to minimize upper body motion and a continuous ramp protocol to ensure a linear increment in work rate and resulting VO2. Upright positioning most closely mimics normal physical activity but either upright or supine exercise can be utilized to derive Ppa–flow relationships [87]. Radial arterial line placement allows precise systemic blood pressure measurement, as well as serial arterial blood gases, to assess important indicators of pulmonary vascular function, including dead space volume/tidal volume, alveolar–arterial gradient and direct Fick cardiac outputs when coupled with assessment of oxygen uptake and mixed venous saturation.
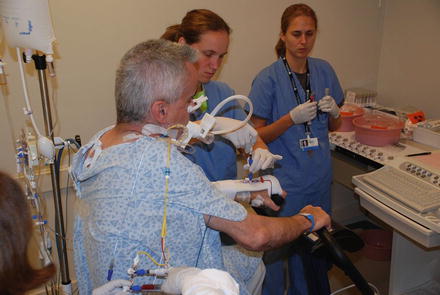
Fig. 11.8
iCPET setup at BWH. Non invasive CPET with breath-by breath measurement of pulmonary gas exchange and ventilation is combined with simultaneous radial and pulmonary arterial blood gas and pH sampling every minute at rest and incremental maximum exercise
We use an ultrasound-guided internal jugular approach to PAC placement so cycling exercise is unimpeded. The optimal zero reference point for central pressures (approximating the right atrium) has recently been reviewed for supine RHC [88]. It has been suggested that in the upright position mid right atrial ZRP is well approximated by the fourth intercostal space at the junction with the sternum and is used by our laboratory. Pulmonary capillary wedge pressure (PCWP) should be verified based on characteristic waveforms, systemic oxygen saturation, and/or appearance on fluoroscopy. The critical extravascular closure pressure imposed by the lung parenchyma that contains the pulmonary vasculature is typically below that of the PCWP during exercise [89], and therefore PCWP can be used as the downstream pressure in order to determine transpulmonary pressure gradients (TPG = mPAP-PCWP) and pulmonary vascular resistance (PVR = TPG/CO). Care should be taken to maintain consistent upright posture relative to the leveled transducers throughout exercise. Serial measurements of mPAP, PCWP, and CO should be performed at regular intervals (i.e., every minute) during incremental exercise to characterize pressure–flow relationships.
Pleural pressure swings and their influence on pulmonary artery input and outflow pressures and beat-to-beat stroke volume deserve special discussion. For instance, the exaggerated end expiratory pressures seen in the obese patient and in COPD do likely contribute dynamically increased right heart afterload by compression of alveolar vessels, which may in turn contribute to the patient’s exertional intolerance. If, however, one assumes iCPET’s clinical role is in the detection of early pulmonary vasculopathy or HFpEF, one might wish to eliminate the confounding effects of respiratory pressure swings. The classic approach to the problem was to ignore it and take a mean PAP or PCWP through the respiratory cycle. In the 1980s, end-expiratory measures came into vogue, largely in the mechanically ventilated patient, when it was assumed zero airway flow at end expiration would result in the least contamination of PAC derived pressures and this has recently been recommended for supine, resting RHC [90] and utilized during exercise [91, 92].
When measuring hemodynamics during exercise in COPD, subtracting esophageal pressure (Pes), in order to acquire the true intra‐cavitary and thereby deriving actual transmural pressure which is critical in the detection of pulmonary vascular disease, is preferable [93]. The usefulness of the RAP waveform to estimate the pressure surrounding the heart was shown by Tyberg et al. [94]. This method assumes that pressure in the very compliant right atrium is predominantly dependent on pressure surrounding the heart (pericardial pressure, or in our case ITP), rather than by right atrial volume. We showed that this method was useful during exercise in COPD‐patients, as long as the lowest point of the RAP during expiration was used. This is explained by the fact that during the right atrial contraction dissociation between RAP and ITP is created. Therefore, only the pressure of an empty and relaxing right atrium is useful to estimate ITP. We found a small bias with mPAPtm and PCWPtm when RAPnadir was used to correct expiratory mPAP and PCWP, with a very reasonable 95 % CI. This method may not be useful in patients with more pronounced right heart failure, as this causes RAP to rise, even during relaxation.
We have recently examined the worst case scenario: moderate to severe COPD referred for evaluation of suspected PH with exercise [95]. Central hemodynamics were measured simultaneously with esophageal pressure during exercise in 30 COPD patients. mPAP and PCWP were assessed in four different manners:
1.
At end‐expiration.
2.
Averaged over the respiratory cycle.
3.
Corrected from the right atrial pressure (RAP) nadir.
4.
Corrected from the RAP respiratory swing and compared with the “gold standard” transmural mPAP and PCWP.
An example of a severe COPD patient’s PAP’s during exercise with and without correction for ITP is shown in Fig. 11.9. Maximum exercise cardiac output was 10.9 ± 3.8 L/min. The large swings in Peso were transduced into all central pressure; on average responsible for a difference between inspiratory values and expiratory values of about 20 mmHg. The expiratory Peso at maximal exercise ranged from +3 to + 25 mmHg. The mPAP/Q slope decreased from 6.4 ± 3.7–4.4 ± 3.2 mmHg/L (p < 0.001) after correction for ITP. Seven patients had a mPAP/Q slope >3 mmHg before correction which decreased to <3 mmHg after correction for the ITP. Twenty‐two patients had a PCWP recording. Nineteen patients of the 22 had a PCWP >20 mmHg with exercise without correction for ITP. Seven patients a had PCPWtm > 20; in three of them PCPWtm was between 20 and 25 mmHg.
Fig. 11.9
Simultaneous measurement of RAP and esophageal pressure (Peso) at maximal exercise in the same patient as shown in Fig. 11.1. RAPnadir is the lowest point in RAP during expiration, which represents RAP during relaxation. Note that RAP falls towards Peso during relaxation. RAPswing was determined as the difference between inspiratory RAP and expiratory RAP [95]
“Gold standard” mPAPtm and PCWPtm at maximum exercise were 47 ± 15 and 17 ± 8 mmHg respectively (Fig. 11.10). The average mPAP values at maximal exercise of the four methods were; mPAPend‐exp: 59 ± 14, mPAPaveraged: 50 ± 14, mPAPrap‐nadir: 44 ± 15, and mPAPrap_swing: 38 ± 15 mmHg. The average PCWP values at maximum exercise of the four methods were; PCWPend‐exp: 27 ± 9, PCWPaveraged: 20 ± 8, PCWPrap‐nadir: 15 ± 7, and PCWPswing: 11 ± 8 mmHg.
Fig. 11.10
Example of pulmonary artery pressure before (PAP) and after (PAPtm) continuous correction for esophageal pressure (Peso) at maximal exercise in a patient with severe COPD (FEV1: 30 % of predicted) [95]
Bland‐Altman analyses showed the best agreement of mPAP (Fig. 11.11) averaged over the respiratory cycle (bias: 2.5 mmHg, limits‐of‐agreement (−6.0 to 11.8) and when corrected with the nadir of RAP (bias: −3.6 mmHg, limits: −11.2 to 3.9). Measuring mPAP at end‐expiration (bias: 10.3 mmHg, limits: 0.5–20.3) and mPAP corrected with the RAP‐swing (bias: −9.3 mmHg, limits: −19.8 to 2.1) resulted in lower levels of agreement (Fig. 11.12). Bland‐Altman plots of the four methods of PCWP measurements during exercise were similar and are shown in Fig. 11.13; both are summarized in Table 11.2.
Fig. 11.11
Average pressure flow relations before and after correction for esophageal pressure. mPAP mean pulmonary artery pressure, mPAPtm transmural mPAP (calculated as mPAP‐Peso), PCWP pulmonary capillary wedge pressure, PCWPtm transmural PCWP (calculated as PCWP‐Peso). **p < 0.01, ***p > 0.001 [95]
Fig. 11.12
Bland‐Altman analyses of the difference between pulmonary artery pressure (mPAP) and transmural mean pulmonary artery pressure (mPAPtm) plotted vs. the mPAPtm. (a) mPAP measured at end expiration, (b) mPAP averaged over the respiratory cycle (c) mPAP corrected with the lowest point of RAP during expiration (RAP‐nadir) and (d) mPAP corrected with the swing in RAP (RAP‐swing). Dotted lines represent the 95 % coincidence intervals [95]
Fig. 11.13
Bland‐Altman analyses of the difference between pulmonary capillary wedge pressure (PCWP) and transmural pulmonary capillary wedge pressure (PCWPtm) plotted vs. the PCWPtm. (a) PCWP measured at end expiration, (b) PCWP averaged over the respiratory cycle (c) PCWP corrected with the lowest point of RAP during expiration (RAP‐nadir) and (d) PCWP corrected with the swing in RAP (RAP‐swing). Dotted lines represent the 95 % coincidence intervals [95]
95 % limits of agreement (mmHg) | |||||
|---|---|---|---|---|---|
Number | r 2 | Bias ± SD (mmHg) | From | To | |
mPAPend expiratory | 30 | 0.86 | 10.3 ± 5.9 | 0.5 | 20.3 |
mPAPaveraged | 30 | 0.92 | 2.5 ± 4.4 | −6.0 | 11.8 |
mPAPrap_nadir | 30 | 0.94 | −3.6 ± 3.8 | −11.2 | 3.9 |
mPAPrap_swing | 30 | 0.86 | −9.3 ± 5.9 | −19.8 | 2.1 |
PCWPend expiratory | 22 | 0.69 | 9.9 ± 5.3 | −0.5 | 20.3 |
PCWP averaged | 22 | 0.75 | 3.2 ± 4.4 | −5.3 | 11.8 |
PCWPrap_nadir | 22 | 0.73 | −2.0 ± 42 | −2.0 | 4.2 |
PCWPrap_swing | 22 | 0.64 | −6.3 ± 5.3 | −16.6 | 4.0 |
Our findings support the use of mPAP and PCWP averaged over 2–3 respiratory cycles in order to acquire more accurate assessment of the transmural values of mPAP and PCWP during exercise in COPD‐patients. The patients in the present study showed a wide range of expiratory Peso at exercise, reaching to as high as 25 mmHg, which is consistent with previous studies on pulmonary mechanics. In these studies, as well as the present study, the positive excursion of Peso during expiration is at least as large as the negative excursion during inspiration. It is therefore not surprising that mPAP averaged over the respiratory cycle is a more realistic measure of intravascular pressure. Albeit more accurate than mPAPend‐exp, mPAPaveraged was still a slight overestimation, which can be explained by the increased expiratory time.
Lastly, we showed that the swings in mPAP, PCWP and RAP were similar (r 2 = 0.82, slope: 0.95 ± 0.1) (Fig. 11.14). This has several convenient implications. The consequence of an identical effect of ITP swing on mPAP and PCWP is that the difference between the two, the transpulmonary pressure gradient is unaffected by the swing in ITP. This only holds when both the mPAP and PCWP being recorded at the same time point in the respiratory cycle. So, although individually, mPAP and PCWP are overestimations of intravascular pressure, the mPAPend‐expand PCWPend‐exp combined lead to the correct transpulmonary pressure gradient or PVR (transpulmonary gradient/CO). It underscores the importance of PVR as part of the suggested definition of exercise induced pulmonary arterial hypertension [7], as it prevents patients being diagnosed simply because of an increased ITP.
Fig. 11.14
Illustrates the relation between mPAPswing and PWCPswing. The swing in mPAP and PCWP did not differ (mean difference 0.9 mmHg, p = 0.35). There was a strict relation between RAPswing and PCWPswing (r 2 = 0.9, p < 0.001) with a slope 1.02 and no significant difference between RAPswing and PCWPswing (mean difference 0.7 mmHg, p = 0.28) [95]
The similar effect of ITP swings in RAP and PCWP also has a potential implication in evaluating exercise hemodynamics. The increase in PCWP calculated as a ratio to the increase in RAP (∆PCWP/∆RAP), as previously suggested [25, 96], is unaffected by ITP swings. This ratio might therefore be of potential help in the difficult situation of a high PCWP with exercise in the presence of ITP‐ swings. This would be especially helpful in diagnosing exercise‐induced HFpEF [97].
Stay updated, free articles. Join our Telegram channel

Full access? Get Clinical Tree


