Figure 8-1.
Success rates of VT ablation. The VTACH study [14] was a multicenter, open-label, randomized, controlled trial that enrolled patients with at least one prior VT episode and a history of coronary artery disease who were to undergo ICD implantation for secondary prevention. A total of 110 patients at 16 centers were randomly assigned to undergo either ICD implantation plus VT ablation, or ICD implantation alone. The primary end point was time from defibrillator implantation to recurrence of sustained ventricular arrhythmias. The protocol recommended traditional activation and entrainment mapping in conjunction with electroanatomic mapping used to identify substrate (discussed in subsequent figures). Additional imaging techniques to further refine targets for ablation were not part of the protocol. The primary end point of the study was positive (15.9 vs. 11.3 months to first recurrence; P = 0.045), as the Kaplan–Meier curves demonstrate. However, even in the ablation group, a significant number of patients had recurrence of ventricular arrhythmias (41 % at 12 months, 53 % at 24 months), demonstrating the need for further improvement to the procedure, possibly by including additional imaging modalities to define ablation targets. VF ventricular fibrillation.
Table 8-1.
Traditional mapping methods.
Method | Description | Strengths | Weaknesses |
|---|---|---|---|
Entrainment | Pacing during tachycardia, with responses indicating proximity of pacing catheter to tachycardia circuit | Localizes tachycardia Identifies different parts of tachycardia circuit (isthmus, exit site, outer loop) | Requires inducible, sustained, hemodynamically stable tachycardia |
Activation | Sensing during tachycardia, with earlier signal demonstrating catheter is close to or within circuit | Localizes tachycardia Identifies different parts of tachycardia circuit (isthmus, exit site, outer loop) | Requires inducible, sustained, hemodynamically stable tachycardia |
Pace match | Pacing during sinus rhythm with comparison of paced-beat QRS morphology with QRS morphology of tachycardia | Does not require sustained, hemodynamically stable tachycardia | Requires ECG of tachycardia Areas of functional block may vary |
Electroanatomic | Measurement of voltage signal strength, with higher or normal voltage indicating healthy myocardium and lower voltage indicating areas of scar | Does not require ECG of tachycardia | Cannot identify tachycardia circuit, only areas of substrate at risk for causing tachycardia |
Signal analysis | Assessment of signal characteristics in addition to voltage, such as electrogram fractionation, local abnormal ventricular activity, and diastolic potentials | In conjunction with electroanatomic mapping, can identify areas likely to be part of tachycardia circuit | Abnormal signals also may be found in areas of scar not in clinical tachycardia circuit |
Table 8-2.
Imaging for VT ablation guidance.
Method | Possible benefits |
|---|---|
CT | Assesses segmental anatomic (wall thickness), dynamic (wall thickening and motion), and perfusion (hypo/hyperenhancement) abnormalities, which can predict electroanatomic abnormalities |
MRI | Assesses areas of scar via late gadolinium enhancement |
SPECT | Assesses regional myocardial perfusion and sarcolemmal or mitochondrial integrity, thereby differentiating viable from scarred myocardium |
FDG-PET | Assesses metabolically abnormal myocardium |
MIBG | Assesses areas of abnormal cardiac sympathetic innervation |


Figure 8-2.
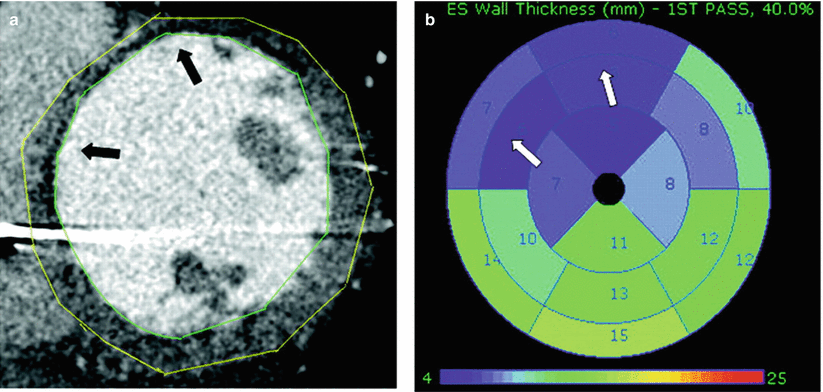
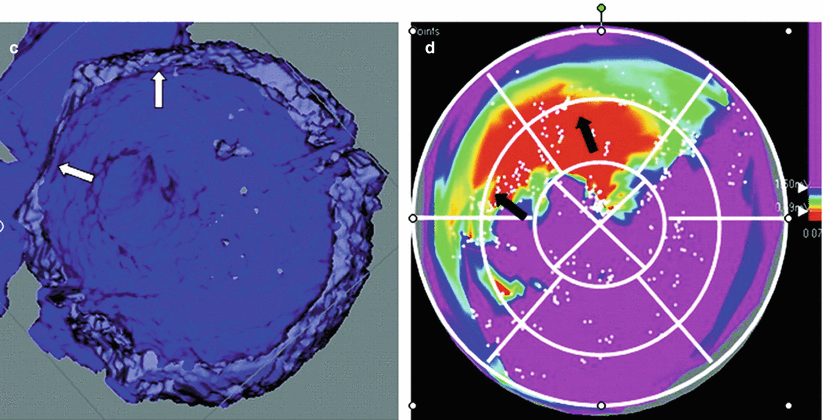
Contrast-enhanced CT. Contrast-enhanced CT may help in locating regions of scar exhibiting low voltage on electroanatomic mapping by incorporating perfusion (first-pass hypoperfusion or delayed enhancement), dynamic (wall motion, wall thickening), and anatomic (wall thinning) characteristics. (a), the anterior septum is thinned (arrows) compared with other myocardial segments, consistent with scar. Endocardium and epicardium are delineated with green and yellow lines, respectively. ICD metal streak artifact is noted in the septal and lateral walls. (b), Polar plot analysis of the ventricle based on end-systolic wall thickness. The wall thickness is assessed for each of the 17 segments, and the corresponding thickness (in millimeters) is shown for each segment. Note the color scale from green (normal thickness) to purple (abnormally thin), demonstrating the corresponding wall thinning in the anteroseptal wall segments (arrows). (c), three-dimensional (3D) reconstruction in short axis; arrows mark the scar region with visible wall thinning. (d), 17-segment analysis of the corresponding endocardial voltage map. Voltage-defined scar (red) is displayed in the same anteroseptal wall segments (arrows) as wall thinning in b, c (From Tian et al. [2]).

Figure 8-3.
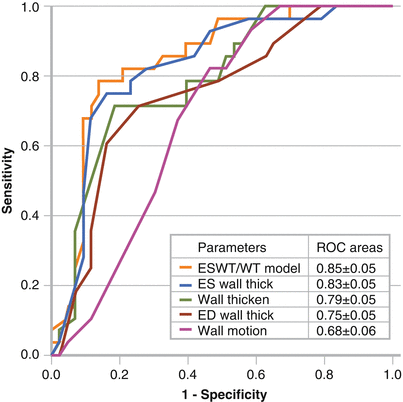
CT parameters to predict scar. Multiple parameters from contrast-enhanced cardiac CT were evaluated, including end-systolic (ES) wall thickness (ESWT), end-diastolic (ED) wall thickness, wall thickening (WT), and wall motion. ESWT and WT also were analyzed together, and this combination was best at predicting ventricular scar based on electroanatomic mapping, with ESWT being the best single parameter. Both these parameters were statistically better than wall motion. The combination correctly classified 81.7 % of voltage segments into the appropriate category. The discrepancy between electroanatomic mapping and cardiac CT may the result of several factors. Small amounts of endocardial scar may result in decreased bipolar voltage, but may not yet result in significant anatomic and dynamic CT parameter changes. On the other hand, CT may be more sensitive at locating nonendocardial scar. Low-voltage areas on electroanatomic mapping that correspond to normal myocardium on cardiac CT may the result of poor catheter contact and falsely low voltage readings during mapping. ROC receiver operating characteristic (Adapted from Tian et al. [2]).

Figure 8-4.
Cardiac MRI. Gadolinium-enhanced cardiac MRI can identify scar substrate for VT before ablation, potentially shortening procedure times and increasing success rates. This figure shows MRI-guided detection and ablation of mid-myocardial scar using traditional MRI sequences. (a), 3D electroanatomic map showing normal endocardial voltage, with the lowest bipolar voltage of 1.56 mV (categorized as normal myocardium) seen at the lateral left LV wall (yellow point). Based only on these data, there is little information available to guide pace match mapping or substrate modification. (b), however, the patient’s corresponding gadolinium-enhanced cardiac MRI scan (in location of the white slice in a) demonstrates mid-myocardial scar with epicardial extension. (c), the image is reconstructed and registered to the endocardial voltage map, and is used to guide successful ablation. (d), comparison of the clinical VT (left) with the pace map match at the yellow point demonstrates a close similarity (>11/12 pace match; right), suggesting an endocardial exit site of the VT. Ablation at this site eliminated the VT (From Dickfeld et al. [1]).

Figure 8-5.
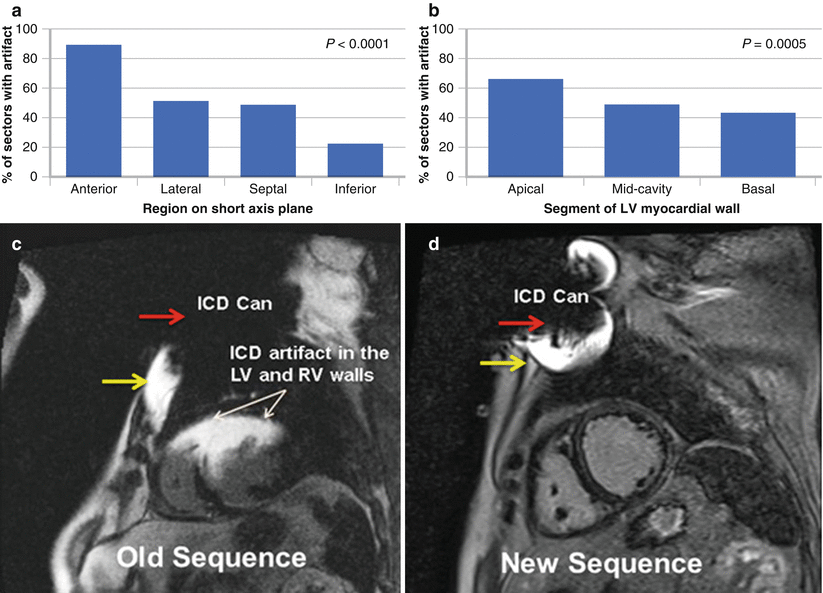
ICD artifact on MRI. Although gadolinium-enhanced cardiac MRI can assess myocardial scar in patients with VT before they undergo ablation, a potential drawback is the risk of device-associated artifact limiting MRI interpretation. In traditional late gadolinium MRI sequences, central signal void and peripheral increased signal intensity may be seen as a result of full and partial voxel dephasing. Although artifact often is present in the anterior wall, full or partial scar assessment is still possible in the rest of the myocardial segments. Additionally, new MRI sequences for scar characterization using bandwidth modulation significantly reduce ICD-induced artifact and are undergoing clinical testing. Successful ablation sites display late gadolinium enhancement (LGE) in nearly all cases, and can be registered to clinical mapping systems to guide VT ablation. This figure shows the areas of greatest impact of device-related artifact on evaluating cardiac fibrosis as assessed by LGE. (a, b), as seen here, the anterior and apical regions are most affected. In a series of 31 patients imaged with the traditional LGE protocol [21], at least some artifact was present in all patients. As a total proportion of LV myocardial area determined on short axis imaging, 54 % of the myocardium was affected. Nevertheless, in all but one patient, a sufficient number of the LGE sequences were still interpretable, allowing for meaningful clinical utility in planning for VT ablation. (c, d), images exemplifying newer techniques for artifact suppression. (c), short axis slice at the mid-myocardium level using the standard LGE protocol. The black center correlates with the location of the ICD can (red arrow), leading to complete dephasing of the MRI voxel, resulting in a signal void. Surrounding this area is a “white halo” of high signal intensity, corresponding to partial MRI voxel dephasing (yellow arrow). Significant artifact is seen, affecting the assessment of LGE in the anterior and anteroseptal walls. (d), short axis image at the same level in the same patient, obtained by using a novel inversion sequence. No significant artifact involving the LV myocardium is noted, allowing complete assessment of myocardial scar. RV right ventricular (a, b adapted from Mesubi et al. [21]).
Table 8-3.
Safety of cardiac MRI in patients with an ICD.
Parametera | Pre-MRI | Post-MRI | Follow-up | P (pre/post)b |
|---|---|---|---|---|
P-wave amplitude, mV | 3.3 ± 2.1 | 3.0 ± 1.4 | 3.1 ± 1.6 | 0.35 |
R-wave amplitude, mV | 9.9 ± 5.2 | 10.2 ± 5.4 | 10.1 ± 5.9 | 0.09 |
Atrial lead impedance, Ω | 475 ± 78 | 476 ± 69 | 462 ± 83 | 0.51 |
Ventricular lead impedance, Ω | 461 ± 97 | 451 ± 89 | 450 ± 95 | 0.82 |
Shock impedance, Ω | 45 ± 8 | 45 ± 8 | 44 ± 7 | 0.34 |
Atrial capture, V | 1.5 ± 0.9 | 1.4 ± 0.9 | 1.5 ± 1.0 | 0.32 |
V × ms | 0.41 ± 0.23 | 0.41 ± 0.22 | 0.41 ± 0.28
Stay updated, free articles. Join our Telegram channel
Full access? Get Clinical Tree
 Get Clinical Tree app for offline access

|