Generalized lipodystrophy is a rare disorder characterized by marked loss of adipose tissue with reduced triglyceride storage capacity, leading to a severe form of metabolic syndrome including hypertriglyceridemia, insulin resistance, type 2 diabetes mellitus, and hepatic steatosis. Recent echocardiographic studies suggest that concentric left ventricular (LV) hypertrophy is another characteristic feature of this syndrome, but the mechanism remains unknown. It has recently been hypothesized that the LV hypertrophy could be an extreme clinical example of “lipotoxic cardiomyopathy”: excessive myocyte accumulation of triglyceride leading to adverse hypertrophic signaling. To test this hypothesis, the first cardiac magnetic resonance study of patients with generalized lipodystrophy was performed, using magnetic resonance imaging and localized proton spectroscopy to detect excessive triglyceride content in the hypertrophied myocytes. Six patients with generalized lipodystrophy and 6 healthy controls matched for age, gender, and body mass index were studied. As hypothesized, myocardial triglyceride content was threefold higher in patients than controls: 0.6 ± 0.2% versus 0.2 ± 0.1% (p = 0.004). The presence of pericardial fat was also found, representing a previously undescribed adipose depot in generalized lipodystrophy. Patients with generalized lipodystrophy, compared with controls, also had a striking degree of concentric LV hypertrophy, independent of blood pressure: LV mass index 101.0 ± 18.3 versus 69.0 ± 17.7 g/m 2 , respectively (p = 0.02), and LV concentricity 1.3 ± 0.3 versus 0.99 ± 0.1 g/ml, respectively (p = 0.04). In conclusion, these findings advance the lipotoxicity hypothesis as a putative underlying mechanism for the dramatic concentric LV hypertrophy found in generalized lipodystrophy.
Lipodystrophy is an extremely rare disorder characterized by loss of body fat and thus deficiency of the adipocytokines, such as leptin and adiponectin. The cause can be either inherited or acquired, and the loss of body fat may be generalized or partial. Patients with generalized lipodystrophy are markedly leptin deficient and are severely hyperphagic, but they have no adipose tissue to store the excess energy, leading to ectopic deposition of triglyceride in nonadipose tissue, most notably the parenchymal cells of the liver and skeletal muscle. Consequently, they develop a severe form of metabolic syndrome with insulin resistance, type 2 diabetes mellitus, hypertriglyceridemia, and nonalcoholic fatty liver disease. Recent echocardiographic studies suggest that concentric left ventricular (LV) hypertrophy constitutes another common feature of patients with either congenital or acquired generalized lipodystrophy. Although the precise underlying mechanism remains unknown, an attractive hypothesis is that the LV hypertrophy could be an extreme clinical example of “lipotoxic cardiomyopathy”: excessive myocyte accumulation of triglyceride (i.e., “cardiac steatosis”) leading to adverse hypertrophic signaling. However, myocardial triglyceride content has not previously been measured in these patients. We therefore used magnetic resonance imaging (MRI) and localized proton magnetic resonance spectroscopy (MRS) to determine if there was a relation between myocardial hypertrophy and triglyceride content in patients with generalized lipodystrophy.
Methods
Six patients with generalized lipodystrophy (2 with congenital generalized lipodystrophy type 1 due to acylglycerol phosphate acyltransferase isoform 2 gene mutations, 3 with type 2 congenital generalized lipodystrophy due to Berardinelli-Seip congenital lipodystrophy 2 gene mutations, and 1 with acquired generalized lipodystrophy) were recruited for the present investigation. For cross-sectional comparison, 6 healthy control subjects, matched for age, gender, and body mass index, without metabolic disease, were selected from an existing database. The study was approved by the Institutional Review Board of the University of Texas Southwestern Medical Center, and all participants provided written informed consent before the study.
Body mass index was calculated as weight in kilograms divided by the square of height in meters. Body surface area was calculated according to the formula of DuBois and DuBois. Blood pressure was measured in the seated position, with a validated oscillometric sphygmomanometer (series 52000; Welch Allyn, Inc., Arden, North Carolina), with an appropriately sized cuff placed on the upper left arm. Venous blood samples were obtained from all participants and processed according to standard laboratory procedures.
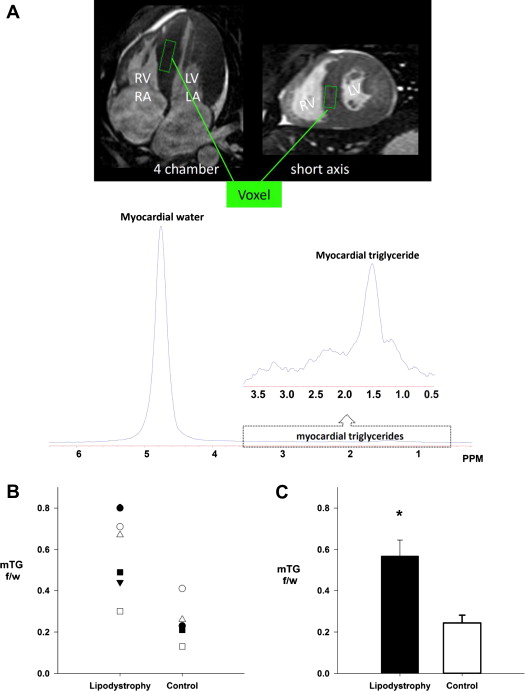
All cardiac magnetic resonance experiments were performed using a 1.5-T Gyroscan Intera whole-body magnetic resonance system (Philips Medical Systems, Best, The Netherlands). Cardiac MRI was used to assess LV morphology, as previously described. Cardiac MRS was used for the noninvasive quantification of cardiac triglyceride content, as described in detail elsewhere. Briefly, image-guided MRS was performed with the following imaging parameters: repetition time 4 seconds, echo time 25 ms, and 1,024 data points over a 1,000-kHz spectral width. The volume of interest (voxel) was centered over the intraventricular septum at end-systole to avoid vascular structures and gross adipose tissue deposits and to ensure consistent orientation of muscle fibers along the magnetic field ( Figure 1 ). Spectra were processed and resonances quantified using a standard analysis package (NUTS; ACORNNMR, Fremont, California). Myocardial triglyceride content is expressed as a percentage of the intensity of the water resonance peak.
Cross-sectional comparisons (patients vs controls) were performed using independent-samples Student’s t tests. The level of significance was set a priori at p ≤0.05. Data are reported as mean ± SE, unless otherwise specified.
Results
Patient-specific characteristics are listed in Table 1 . Patients and controls were well matched for age, height, and weight, and therefore no differences in body surface area or body mass index were found. As expected, patients had elevated circulating triglycerides and fasting glucose, with 4 of the 6 patients being treated with insulin (patients from pairs 1, 3, 4, and 6; Table 1 ). One patient (pair 6) was being treated with a lipid-lowering medication at the time of the study. No difference in serum cholesterol level was found, whereas high-density lipoprotein cholesterol was significantly lower in patients compared with controls. Blood pressure was similar between the 2 groups and in the normotensive range, except for 2 patients with lipodystrophy (pairs 3 and 6) whose blood pressures were elevated at the time of the study.
| Variable | Pair 1 | Pair 2 | Pair 3 | Pair 4 | Pair 5 | Pair 6 | Mean ± SD | p Value | |||||||
|---|---|---|---|---|---|---|---|---|---|---|---|---|---|---|---|
| Patient | Control | Patient | Control | Patient | Control | Patient | Control | Patient | Control | Patient | Control | Patient | Control | ||
| Anthropometrics | |||||||||||||||
| Age (yrs) | 16 | 23 | 18 | 33 | 20 | 19 | 21 | 22 | 23 | 23 | 30 | 27 | 21 ± 5 | 24 ± 5 | 0.288 |
| Gender | F | F | F | F | M | M | M | M | F | F | F | F | — | — | |
| Height (cm) | 160 | 158 | 162 | 160 | 175 | 173 | 163 | 184 | 176 | 160 | 171 | 168 | 168 ± 7 | 167 ± 0.1 | 0.941 |
| Weight (kg) | 50 | 51 | 47 | 46 | 83.4 | 86 | 66 | 81 | 72 | 55.9 | 71.3 | 65.8 | 64.9 ± 14.0 | 64.3 ± 16.3 | 0.897 |
| Body mass index (kg/m 2 ) | 19.5 | 20.4 | 17.9 | 18.0 | 27.2 | 28.7 | 24.8 | 23.9 | 23.2 | 21.8 | 24.4 | 23.3 | 22.9 ± 3.5 | 22.7 ± 3.6 | 0.944 |
| Body surface area (m 2 ) | 1.5 | 1.5 | 1.5 | 1.5 | 2.0 | 2.0 | 1.7 | 2.0 | 1.9 | 1.6 | 1.8 | 1.8 | 1.7 ± 0.2 | 1.7 ± 0.3 | 0.924 |
| Hemodynamics | |||||||||||||||
| Systolic blood pressure (mm Hg) | 120 | 112 | 106 | 118 | 142 | 141 | 125 | 122 | 122 | 106 | 166 | 136 | 130 ± 21 | 122 ± 14 | 0.470 |
| Diastolic blood pressure (mm Hg) | 76 | 74 | 60 | 69 | 71 | 71 | 78 | 67 | 76 | 63 | 98 | 86 | 77 ± 12 | 72 ± 8 | 0.440 |
| Mean arterial pressure (mm Hg) | 91 | 87 | 75 | 85 | 95 | 94 | 94 | 85 | 91 | 77 | 121 | 102 | 94 ± 145 | 89 ± 9 | 0.427 |
| Heart rate (beats/min) | 85 | 84 | 80 | 86 | 82 | 67 | 85 | 56 | 75 | 60 | 105 | 78 | 85 ± 10 | 69 ± 12 | 0.038 |
| LV morphology | |||||||||||||||
| End-diastolic volume (ml) | 120 | 111.6 | 103.4 | 77.7 | 178.1 | 141 | 142.6 | 169.5 | 137.9 | 121.2 | 127.5 | 93.6 | 135.0 ± 25.3 | 119.1 ± 33.0 | 0.372 |
| End-systolic volume (ml) | 45.3 | 51.7 | 33.5 | 27.2 | 76.5 | 53.2 | 50.6 | 44.5 | 56.5 | 46.5 | 51.9 | 27.9 | 52.4 ± 14.2 | 41.8 ± 11.5 | 0.188 |
| Stroke volume (ml) | 75.1 | 60 | 69.9 | 50.5 | 101.6 | 87.8 | 92 | 125.0 | 81.4 | 74.7 | 75.6 | 65.7 | 82.6 ± 12.0 | 77.3 ± 26.6 | 0.665 |
| Ejection fraction (%) | 62 | 54 | 67.7 | 67 | 57 | 62 | 65 | 73.7 | 59 | 61.7 | 59 | 70 | 62 ± 4 | 65 ± 7 | 0.372 |
| Mass (g) | 147.5 | 99.5 | 110.7 | 65.4 | 212.0 | 140.4 | 196 | 195 | 163.4 | 126.3 | 229.1 | 98.6 | 176.4 ± 44.2 | 120.9 ± 44.6 | 0.055 |
| Mass index (g/m 2 ) | 98.2 | 66.3 | 75.0 | 45.1 | 106.5 | 70.2 | 114.5 | 95.6 | 87 | 80.3 | 125.1 | 56.4 | 101.0 ± 18.3 | 69.0 ± 17.7 | 0.012 |
| Concentricity (g/ml) | 1.2 | 0.9 | 1.1 | 0.8 | 1.2 | 1.0 | 1.4 | 1.2 | 1.2 | 1.0 | 1.8 | 1.0 | 1.3 ± 0.3 | 0.99 ± 0.1 | 0.023 |
| Blood chemistry | |||||||||||||||
| Glucose (mg/dl) | 237 | 89 | 81 | 86 | 303 | 99 | 182 | 90 | 81 | 80 | 105 | 94 | 164.8 ± 91.9 | 89.7 ± 6.5 | 0.07 |
| Triglycerides (mg/dl) | 1,420 | 123 | 66.3 | 72 | 2,270 | 193 | 90 | 42 | 663 | 34 | 702 | 82 | 968.0 ± 765.1 | 91.0 ± 59.2 | 0.02 |
| Cholesterol (mg/dl) | 291 | 192 | 196 | 167 | 448 | 204 | 129 | 129 | 196 | 137 | 203 | 180 | 243.8 ± 112.6 | 168.2 ± 30.0 | 0.143 |
| High-density lipoproteins (mg/dl) | 32.4 | 61.3 | 27 | 62 | 46.0 | 34.5 | 28.1 | 35 | 27 | 49.4 | 26.4 | 56.7 | 31.2 ± 7.6 | 49.8 ± 12.5 | 0.01 |
Stay updated, free articles. Join our Telegram channel

Full access? Get Clinical Tree


