Fig. 18.1
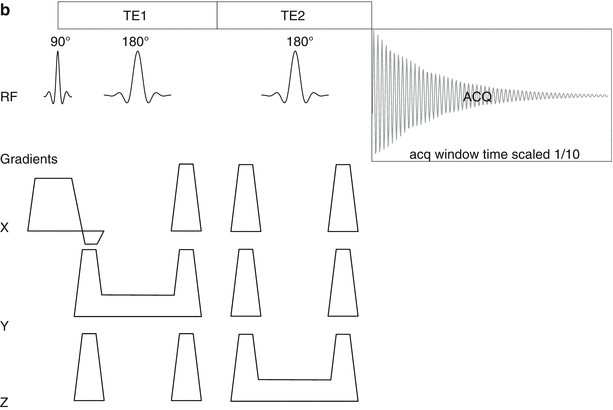
Diagrams of the RF transmit and receive and gradients of the STEAM (a) and PRESS (b) sequences. The data acquisition windows are ten times longer than shown in these diagrams, but otherwise the timings are typical for the sequences set up for the shortest TE possible. The excitation RF refocus and first 180° pulse spoiler gradients are combined to reduce the TE. In STEAM the magnetization is not in the transverse plane in the mixing time TD. This time does not count towards the total TE of the sequence as only (a very small amount of) T1 relaxation takes place. Transverse relaxation happens only during the two TE/2 periods. The effective TE for the PRESS sequence is the sum of the two spin-echo times TE1 and TE2
Much of the experimental approach of cardiac 1H-MRS is identical for either PRESS or STEAM. The TEs are different as they should be set close to the minimum achievable for the sequence on the scanner, but the other sequence parameters, such as selected volume size spectral resolution, receiver bandwidth, offset frequency, repetition rate and some others are all optimally set to the same values for both sequences.
Dealing with Motion
The breathing and cardiac motion makes 1H-MRS far more challenging than single volume brain MRS. First of all it is essential that the sequence be gated to an ECG signal. It is better to spend some time to optimize the ECG than to accept a mediocre signal that causes gating errors. If magnetic field and gradients distort the ECG so much that gating is unreliable a peripheral pulse signal can also be used as a last resort.
The breathing motion can be dealt with in a number of ways [15]. Where available a navigator sequence can be used to monitor the movement of the diaphragm and gate the MRS acquisition to respiratory motion. The most sophisticated version of this is navigator gated and volume tracking 1H-MRS [16]. Using the navigator set on the top of the diaphragm an estimate is made of the cardiac motion due to breathing and the spectroscopy volume position is adjusted for each scan. This technique is not widely available yet, but navigator gating without volume tracking works OK in most cases.
Some researchers have set up the spectroscopy sequence to record each scan individually and then retroactively adjust the phase and frequency of all the recorded scans before averaging the signals, a technique called constructive averaging [17]. This method can lead to great improvements in reproducibility and signal-to-noise ratio (SNR). But doing this constructive averaging automatically needs a strong signal that is visible in one signal acquisition. Doing it manually at post-processing is an option, but this seriously complicates data analysis when each exam requires 32 or 64 scans to be individually inspected for averaging.
Collecting a large number of averages without the on-the-fly constructive averaging carries the risk that one missed trigger adds a bad signal and ruins the entire spectrum. As a compromise, spectra can be recorded in separate sets of four or eight averages. This allows some four or eight step phase cycling, which is always advisable to reduce artifacts due to sequence imperfections. Really failed spectra can be discarded and remaining spectra can be constructively added in post processing.
If navigator gating is not available a pressure band can be used to record the breathing motion [18]. This is less reliable and more difficult to set up correctly. Optimize the placement of the belt with an MRI sequence that does have a navigator sequence. Alternatively spectra can be recorded in breath holds. For a useful MRS result several breath holds will be required. Four breath holds each with 6 signals averaged with water suppression and a short one without gives 24 averages. Provided the consecutive breath-holds are consistent this approach can yield good results.
Water Suppression
For all in vivo 1H-MRS some type of water suppression (WS) is essential. The concentration of creatine and even TG is several orders of magnitude lower than the water signal. Therefore the base of the water peak will severely distort the spectral baseline at the scale of the signals. Also, the water signal can cause interference with some small overtone signals that are caused by acoustic vibrations in the magnet and gradient assembly. These acoustic signals are recognizable as a pair of peaks with opposite phases and equidistant left and right of the water peak.
Pre-saturating the water peak with a series of chemical shift selective pulses, each followed by a crusher gradient pulse, solves both baseline distortion and acoustic side-band problems. There are a number of WS schemes usually designed for 1H-MRS on the brain. For cardiac MRS the choice is limited to short sequences such as chemical shift selective suppression (CHESS) or the somewhat longer three-RF-pulse WET (water suppression enhanced through T1 effects) [19, 20].
Optimization of the WS for each individual is not possible due to motion. Fortunately it is not necessary because any residual water signals can be removed in the data processing stage, as will be discussed later in this chapter. Do test various WS schemes and settings on a volunteer to ensure a reasonably good suppression in all subjects. The aim is to consistently get a better than 50-fold reduction in the water peak height.
An important factor for the success of any WS scheme is finding the correct resonance frequency for water. This step is not trivial because often the preparation phases on the scanner are set up for navigator or ECG gated operation. Motion interferes with WS even in the final gated experiment. If the data acquisition part of the sequence is set in late systole the preceding WS pulses, which can take anything between 100 and 250 ms, could end up in a cardiac phase with more motion, especially with rapid heart rates. Therefore some water frequency shifts are likely to occur during the WS sequence. These shifts create a variable appearance of the remaining water peak that makes the previously discussed constructive averaging unreliable if it is based on the residual water signal.
Choosing a larger suppression bandwidth for the WS RF pulses reduces the chance of missing the water peak due to motion related frequency shifts. As a bonus, wider the bandwidth shorter the RF pulse, therefore the WS scheme can become shorter and easier to fit in the R-R interval. Depending on field strength and experiences with testing one can set the WS width at 60–80 Hz for 3 T. In the heart we do not expect to observe resonances close to water.
Optimal Data Acquisition Parameters
To reduce the effect of cardiac motion the acquisition window should be kept relatively short compared to the length of a heartbeat. This can be done either by limiting the number of free induction data points or by increasing the bandwidth. The acquisition window should still be long relative to the T2* of the observed peaks to avoid truncation of signals. About 1,500 Hz at 256 point resolution is good for a 3 T cardiac 1H spectrum. This keeps the acquisition time <200 ms and the spectral resolution <6 Hz/point. This is more than enough because the line widths at this field strength will rarely be less than 20 Hz. Time domain fitting methods as discussed later in the data processing section are less sensitive to MRS signal truncation artifacts, thus safely allowing shorter acquisition windows.
The receive frequency can often be set independent of the center frequency for volume placement. The latter frequency determines the chemical shift at which the volume placement is accurate. The signals of other chemical shifts will be from locations that are slightly shifted in each of the localization dimensions. The bandwidth of the selective RF pulses of the STEAM or PRESS, relative to the chemical shift in Hz sequence determine the amount of shift. At 3 T the chemical shift difference between water and fat is about 400 Hz. Each 4,000 Hz bandwidth pulse will cause a 10 % shift in the volume between water and fat. Shifting the reference frequency for volume placement by −1.7 ppm cuts the volume shift is cut in half. The correct volume prescription will then be halfway between water (at 4.7 ppm) and lipid (at 1.3 ppm) and spot-on for creatine at 3 ppm.
Spectroscopy Volume Placement
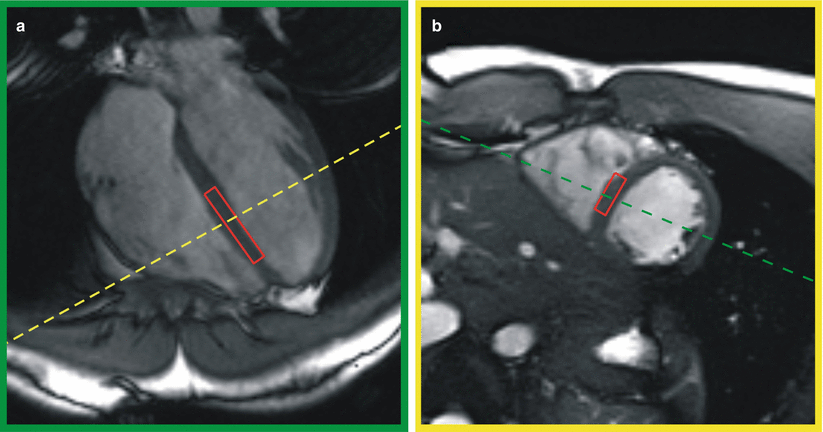
The optimal spectrum volume position is the inter-ventricular septum because this uniquely is a region of the left ventricle that is never clad with pericardial fat. The volume is typically placed using a 4-chamber (4CH) scout image and at least three or four short axis (SA) images (see Fig. 18.2). In a 3 T scanner a volume of 6 × 20 × 40 mm delivers enough SNR for good quality spectra with 32 signals averaged (see Fig. 18.3). Cine images are used to determine the best delay time and ensure that the volume remains on the septum for the remainder of the cardiac cycle. The actual data acquisition will occupy about 200 ms. The spectroscopy volume dimensions should be the largest volume that fits this location because the SNR is directly proportional to the voxel size. The thickness of the septum limits one dimension to no more than 4–6 mm. The curvature of the left ventricle in the SA image plane limits the second dimension to about 10 mm and the base to apex curvature may limit the remaining dimension to anything between 20 and 40 mm.


Fig. 18.2
Spectroscopy volume placement on systolic SSFP cine images in (a) four-chamber view and (b) short axis view. The intersection of the volume with the image plane is shown in red, the intersections of the images with each other are show as dashed green or yellow lines

Fig. 18.3
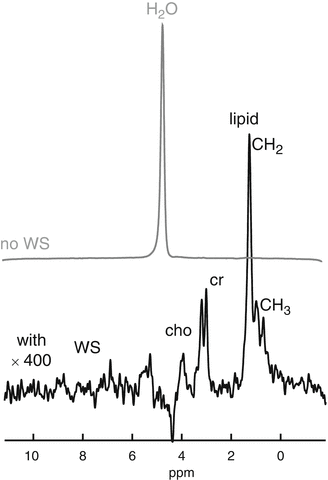
Sample navigator guided PRESS spectra with and without WS. The non WS spectrum WS spectrum (top, grey line), is recorded with 4 signals averaged, the WS spectrum (bottom, black line) was recorded with 32 signals averaged. The WS spectrum is shown with a 400-fold vertical scale magnification. The assigned peaks are (left to right) lipid CH3 at 0.8–0.9 ppm, lipid CH2 at 1.2–1.3 ppm. At 3.0 ppm is the combined creatine+phosphocreatine resonance and next to this at 3.25 ppm the resonance for choline compounds
Spatial saturation slabs may be prescribed at this point to suppress signals from outside the volume, These Outer Volume Suppression (OVS) slabs can be useful when fat is in close contact with the selected volume, but in cardiac 1H-MRS they would typically be set on pericardial fat and on the ribcage. These remote fatty locations should not interfere at all, but as long as the sequence does not come close to SAR limits the inclusion of OVS is not a problem. The OVS does not effectively suppress blood signal because new blood moves in too fast.
Preparation Scans
Much of the sequence optimization for MRI is done automatically. For MRS it is often desirable to go through these steps manually, or at least check the results of these steps. Refer to the scanner manual for instructions, as the default setting is probably automatic background optimization.
By far the most important and difficult step is shimming. As mentioned before, the preparation phase scans are usually not gated. Un-gated manual shimming on a moving target like the heart is virtually impossible. A B0 field mapping technique with a single (expiration) breath-hold scan is by far the best method. Added bonus is that the same B0 field map can also be used to optimize the field over the entire heart and get much better results with rapid cine MRI scans using steady state free precession techniques.
< div class='tao-gold-member'>
Only gold members can continue reading. Log In or Register to continue
Stay updated, free articles. Join our Telegram channel

Full access? Get Clinical Tree


