Cardiac Physical Examination
INTRODUCTION TO PHYSICAL EXAMINATION
Over the years, the bedside skills of the cardiologist have diminished, due in part to the readily available access to echocardiography. However, the cardiology boards expect a high level of understanding of physical diagnosis. Most of the testing of physical diagnosis is indirect. Many of the questions are structured with a brief history and physical exam that provide clues about the diagnosis or answer. Often these are subtle hints that will not be appreciated by the unprepared. This chapter provides many of the pearls of physical diagnosis that are important for taking the boards.
INSPECTION
Basic principles (these descriptors may correlate with specific diagnoses):
 General appearance: Distress, diaphoresis, tachypnea, cyanosis, pallor
 Posture: Orthopnea, platypnea/orthodeoxia (dyspnea and O2 desaturation in the upright position such as seen in patients with patent foramen ovale (PFO) and atrial septal defect (ASD) with R-to-L shunt), trepopnea (dyspnea lying on one side but not the other such as with large pleural effusions)
 Stature: Tall (Marfan syndrome, Acromegaly), short (Turner and Noonan syndrome, Down syndrome), dwarfism (Ellis–van Creveld syndrome associated with ASD)
 Nutritional status: Obese (sleep apnea, metabolic syndrome), cachexia (end-stage systolic heart failure, chronic disease, malignancy), athletic or muscular (anabolic steroid use)
 Abnormal movements: Chorea (Sydenham chorea as seen with rheumatic fever), ataxia (Friedrich ataxia associated with hypertrophic cardiomyopathy [HCM] or tertiary syphilis associated with aortic aneurysms), head bobbing (aortic regurgitation [AR] or tricuspid regurgitation [TR]), Cheyne–Stokes respirations
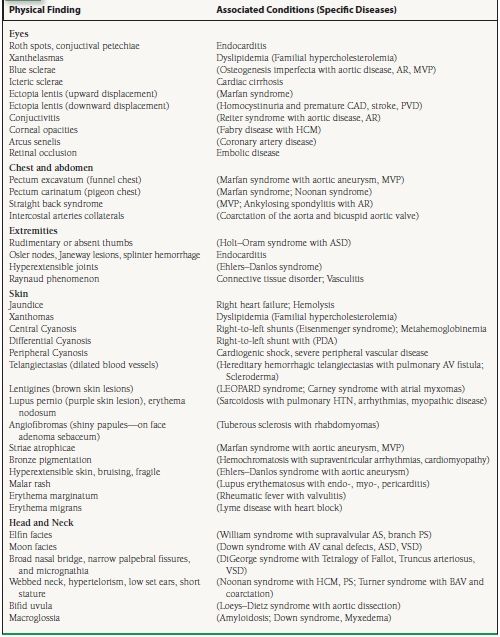
See Table 2.1 for additional associated conditions and specific diseases found with various skin, head and neck, eye, chest and abdomen, extremity findings.
TABLE
2.1 Physical Examination Findings with Associated Conditions and Disease States
ARTERIAL PULSE
Basic Principles
 Described by upstroke, magnitude, and contour
 Composed of percussion (ejection, mid to later portion) and tidal waves (reflected wave from periphery, midlater portion)
 Graded 0 to 4. Grade 0 is absent; Grade 1 is barely palpable; Grade 2 is easily palpable; Grade 3 is normal; and Grade 4 is bounding.
 Normal pulse pressure approximately 30 to 40 mm Hg (systolic minus diastolic blood pressure)
 Anacrotic notch is present at the systolic upstroke in the arterial pulse (ascending limb).
 Dicrotic notch is present in the diastolic downstroke in the arterial pulse (descending limb) at aortic valve closure.
Disease States
See Figure 2.1.
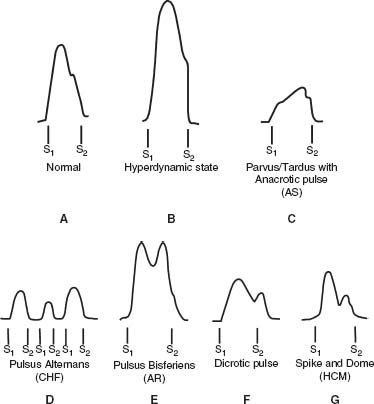
FIGURE 2.1 Carotid pulse findings in normal and disease states. A: The normal carotid pulse. There is a rapid ascending and descending limb. The descending limb is slower than the ascending limb and has a dicrotic notch that occurs during aortic valve closure. The dicrotic notch is generally not palpable on examination. B: Hyperdynamic pulse. There is a rapid, high volume ascending and descending limb. C: Parvus/tardus pulse with anacrotic notch refers to a small-amplitude pulse with a delayed systolic peak associated with AS. The anacrotic notch on the ascending limb may be appreciated on examination. D: Pulsus alternans is the beat-to-beat variation in the arterial pulse amplitude that is seen with left ventricular dysfunction and low stroke volume. E: Pulsus bisferiens is characterized by two systolic peaks during systole. The amplitude of the pulse is high. The initial peak is due to the ejection or percussion wave, and the second peak is due to a reflected or tidal wave in the periphery. This type of pulse is most often seen with isolated AR or combined AR and stenosis. F: Dicrotic pulse is another form of double-peaked pulse where the dicrotic notch is present in diastole just after S2. The dicrotic pulse usually occurs in patients with hypotension due to low CO or low SVR. G: Spike and dome pulse is another form of double-peaked pulse that occurs with HOCM. There is an initial delayed systolic peak followed by a lower-amplitude systolic peak.
Pulsus Alternans
 Alternating beat to beat strong and weak pulsations in sinus rhythm
 Reflects myocardial dysfunction due to alterations in preload, afterload, and contractility with each beat
Pulsus Paradoxus
 Exaggeration of normal inspiratory fall of systolic blood pressure (SBP) > 10 mm Hg
 Causes include cardiac tamponade, chronic lung disease/acute asthma, pulmonary embolism (PE), right ventricular infarction, congestive heart failure, tension pneumothorax, pregnancy, obesity, and rarely constrictive pericarditis (only effusive form)
 Major mechanisms include (a)
  venous return to the right heart during inspiration with shift of the septum to the left resulting in
  left ventricle (LV) stroke volume and therefore
  SBP and (b)
  pulmonary venous reservoir with inspiration resulting in
  left-sided filling (lower pulmonary vein to left ventricular gradient).
 Cardiac tamponade may occur without pulsus paradoxus due to loss of interventricular dependence with high LV enddiastolic pressure (AR or LV dysfunction), ASD (volume of shunted blood exceeds volume of blood between inspiration and expiration), or right ventricular hypertrophy (RVH) and pulmonary hypertension (PH).
 The paradox is that heart sounds can be heard during inspiration, while the pulse weakens and may not be palpable.
 Reversed pulsus paradoxus may occur with HCM or in mechanically ventilated patients.
Double-Peaked Pulse

 amplitude pulse with two systolic peaks
 Results from accentuated percussion wave and tidal wave
 Most common cause is severe AR (bisferiens) with or without aortic stenosis (AS), though may also occur with hypertrophic obstructive cardiomyopathy (HOCM, bifid or “spike and dome”)and hyperdynamic states (patent ductus arteriosus [PDA], arteriovenous malformations).
 Tardus (slow upstroke) and parvus (low amplitude)
 Caused by AS, though may be absent even in the setting of severe AS in elderly with noncompliant carotid vessels
 Associated with an anacrotic pulse
Anacrotic Pulse
 Notch on the upstroke of the carotid pulse (anacrotic notch) may be palpable.
 Two distinct waves can be seen (slow initial upstroke and delayed peak, which is close to S2).
 Present in AS
Dicrotic Pulse
 Accentuated upstroke with second peak after dicrotic notch in diastole (after S2)
 Second peak in diastole differentiates the dicrotic pulse from a bisferiens pulse.
 Occurs in patients with low cardiac output (CO) and high systemic vascular resistance (SVR) or high CO and low SVR (in both cases the systolic pressure is low)
Other miscellaneous signs/findings related to arterial pulse include the following:
Osler Sign
 Obliteration of brachial pulse by BP cuff with sustained palpable and rigid radial artery
 Invasive BP measurements may not correlate with cuff pressures and pseudohypertension may be present.
 Due to atherosclerotic, calcified blood vessels
Pulse Deficit
 Difference in the heart rate by direct cardiac auscultation and the distal arterial pulse rate when in atrial fibrillation (AF)
 Due to short diastoles with short RR interval, the contraction may not be strong enough to generate enough stroke volume to the periphery and thus the peripheral pulse may underestimate the heart rate.
Radial-to-Femoral Delay
 Generally radial and femoral pulse occur at nearly the same time (femoral slightly earlier).
 Due to obstruction of arterial flow due to coarctation, the femoral pulse may be delayed.
 Confirmed by
  in lower-extremity pressure compared to upper-extremity pressure in the supine position
Asymmetric right greater than left pulses and pressures:
 Supravalvular AS: The pool of blood is directed toward the right side of the aorta in greater proportion than to the left (due to the Coanda effect) resulting in a disparity in pulses and pressures, including inequality of carotid pulses.
Pressure/Pulse Difference in Two Arms (>10 mm Hg Systolic)
 Due to obstruction involving the aorta, innominate and subclavian arteries due to the following etiologies: congenital, arteriosclerosis, embolism, arteritis, dissection, postsurgical (subclavian flap repair for coarctation) or external obstruction (thoracic outlet syndrome).
Historical signs of severe AR due to high stroke volume detected by pulse abnormalities include the following:
Hill Sign
 Extreme augmentation of systolic BP in the femoral artery compared with the brachial artery (>40 mm Hg)
 Seen with severe AR
 Results from a summation of waves traveling distally in the aorta
Mayen Sign

 in diastolic BP with arm elevation of >15 mm Hg
Traube Sign “Pistol shot”
 Loud systolic sound heard over the femoral artery
Corrigan Pulse: “Water-Hammer” Pulse
 Large-amplitude upstroke and collapse of the carotid artery pulse due to high CO and low resistance
Duroziez Sign
 Systolic and diastolic bruit heard over the femoral artery with gentle compression
JUGULAR VENOUS PULSE
Basic Principles
 Pressure and waveforms should be evaluated.
 Adjust level of head/torso until pulsations optimally visualized. Generally around 45 degrees.
 Internal jugular preferable to external jugular and right internal jugular preferable to left
 Jugular venous pulse (JVP)
  with inspiration in normal patients
Jugular Venous Pressure
 Measured as the vertical height above the sternal angle or angle of Louis (junction of manubrium and sternum), which is considered to be 5 cm above the right atrium (RA) in all positions
 9-cm H2O is considered elevated.
 Conversion: 1.36 cm H2O = 1 mm Hg
 Abdominojugular reflux (previously referred to as the hepatojugular) can be performed to confirm or determine elevated venous pressure. Application of pressure >10 to 30 seconds over the right upper quadrant (RUQ) results in sustained elevation of jugular pressure ≥4 cm above the sternal angle for >10 seconds following release of pressure. Straining (Valsalva maneuver) must be avoided since it will cause a false reading.
 A wave: RA filling durig RA systole
 C wave: Upward motion tricuspid valve in systole / carotid artery deflection
 X descent: RA relaxation (during RV systole)
 V wave: RA filling during RV systole
 Y descent: Fall in RA pressure when tricuspid valve opens (RV diastolic filling)
Jugular Venous Waveforms
See Figure 2.2.
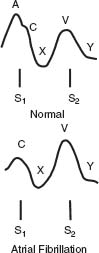
FIGURE 2.2 Internal jugular pulsations in normal individuals and during AF. The physiology attributed to each wave is noted. Typically, there are two positive waves (“a” and “v” waves) and two negative waves (“x” and “y” descents) in normal individuals. The “a” wave is lost with AF. The “c” wave is not appreciable on physical examination. RA, right atrium; RV, right ventricle.
Disease States
See Figure 2.3.
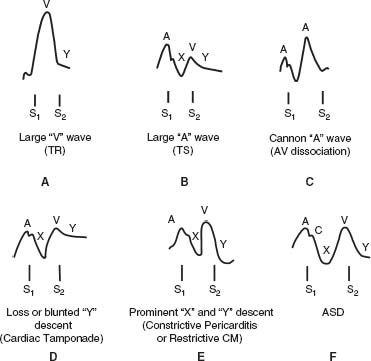
FIGURE 2.3 Internal jugular pulsations during various disease states. A: Large “v” or “cv” wave characteristic of TR along with a rapid “y” descent. B: Large “a” wave as seen with obstruction to right ventricular filling with TS. The “y” descent is slow when TS is present. A large “a” wave without a prominent “y” descent may occur with RVH or PH. C: Cannon “a” waves are present with AV dissociation and describe the presence of intermittent prominent “a” waves that occur during contraction against a closed AV valve during ventricular systole. It should not be confused with a prominent “v” wave. D: Loss or blunting of the “y” descent is an important feature of cardiac tamponade that corresponds with impairment of diastolic filling. E: A prominent “x” and “y” descent is present with either constrictive pericarditis or restrictive cardiomyopathy. The rapid “y” descent is a marker of early rapid filling due to an abnormality of compliance that is seen with both of these conditions. F: The “x” descent and “y” descent with an ASD are equal in amplitude.
 AF—loss of “a” wave resulting in just one major positive wave
 Complete heart block or atrioventricular (AV) dissociation— cannon “a” wave due to contraction against a closed tricuspid valve
 Tricuspid stenosis (TS), RVH, PH, severe left ventricular hypertrophy (LVH)—giant “a” waves
 Severe TR—large “v” wave and rapid “y” descent
 ASD -prominent and equal “a” and “v” waves
 Constrictive pericarditis—prominent “y” descent (predominant filling during early diastole) and sometimes prominent “x” descent giving “w” shape waveform along with elevated jugular venous pressure and Kussmaul sign
 Restrictive cardiomyopathy—prominent “x” and “y” descent may also be present similar to constrictive pericarditis.
 Cardiac tamponade—prominent “x” wave and loss of the “y” descent representing loss of filling in diastole along with elevated jugular venous pressure
 Superior vena cava (SVC) obstruction—elevated but nonpulsatile JVP
Other Miscellaneous Signs/Findings
 Kussmaul sign—paradoxical rise in JVP during inspiration due to increased resistance of RA filling during inspiration. The opposite of the normal fall in JVP with inspiration.
 Classical finding in constrictive pericarditis. May also occur with RV infarct, severe TR or TS, PE, and restrictive cardiomyopathy but is absent with cardiac tamponade except for the effusive constrictive form.
PRECORDIAL MOTION
Basic Principles
 The normal apex moves toward the chest wall in early systole and is best palpated in the fourth or the fifth left intercostal space just medial to the midclavicular line.
 It is 1 to 2 cm in size and lasts less than one-third of systole.
 The apical pulsation is not always the point of maximal impulse (PMI) (e.g., in rheumatic mitral stenosis (MS), the PMI may be produced by the right ventricle).
Hypertrophy
 LVH results in an apical impulse that is sustained and not diffuse.
 RVH or PH results in a left parasternal heave or lift that is sustained and not diffuse.
Dilation
 LV enlargement results in a diffuse, laterally displaced apical impulse.
 RV enlargement results in a diffuse impulse occurring in the parasternal region.
Disease States
 LV aneurysms may produce diffuse outward bulging and a rocking effect.
 Constrictive pericarditis may be characterized by systolic retraction of the chest instead of outward motion (Broadbent sign).
 Hyperactive precordium occurs in volume overload (severe aortic and mitral regurgitation [MR], large left-to-right shunt).
 HCM causes a double systolic outward motion. This is due to a palpable “a” wave (increased atrial filling) and sustained outward movement of the apex. In some patients, there are two systolic motions as well as the motion during atrial systole resulting in a triple apical impulse.
FIRST HEART SOUND
Basic Principles
 Ventricular systole begins with closure of the mitral (first) and tricuspid (second) valves.
 S1 is best heard with the diaphragm of the stethoscope at the apex for the mitral and the left sternal border for the tricuspid valve.
 Opening sounds of the mitral and tricuspid valves are pathologic sounds.
Intensity
 Mitral closure is generally louder than tricuspid closure.
 S1 is generally louder than S2 at the apex and the left sternal border and softer than S2 at the left and the right second interspaces.
S1 (particularly M1) is  with:
with:
 Short PR interval (due to wide separation of leaflets at onset of ventricular systole)
 MS with mobile leaflets
 Hyperdynamic LV function or
  transvalvular flow due to shunts (
 force of leaflet closure)
 TS or ASD (T1
  )
)
S1 is  with:
with:
 Long PR interval (leaflets close together at onset of ventricular systole)
 MS with immobile or calcified leaflets
 Severe AR (due to mitral preclosure from the jet hitting the mitral valve and high left ventricular end diastolic pressure [LVEDP])
 MR due to prolapse or flail (poor coaptation of leaflets)
 Severe LV dysfunction with poor CO (
 force of leaflet closure)
S1 is variable with:
 Atrial fibrillation
 Complete heart block and AV dissociation
Splitting
 Split S1 must be differentiated from an S4 gallop heard best at the apex with the bell of the stethoscope and an ejection sound (ES) (pulmonic or aortic) heard at the base of the heart.
Persistent splitting:
 Late T1 closure due to severe TS, ASD or right bundle branch block (RBBB)
 Late T1 closure due to Ebstein anomaly (S2 also split) with associated multiple systolic and diastolic clicks “sail-like sounds”
 Early M1 closure due to LV preexcitation
Reverse splitting (rare):
 Late M1 closure due to severe MS (usually associated with TR), left bundle branch block (LBBB), RV pacing
SECOND HEART SOUND
Basic Principles
 Ventricular systole ends with closure of the aortic (first) and pulmonic (second) valves.
 S2 closure sounds are heard best with the diaphragm of the stethoscope in the second left and right intercostal spaces near the sternum.
Intensity
 Aortic closure heard best at the second right intercostal space adjacent to the sternum is generally louder than pulmonic closure heard best at the second left intercostal space adjacent to the sternum.
 S2 (A2) is
  with hypertension (HTN), dilated aorta.
 S2 (A2) is
  with AS.
 S2 (P2) is
  with pulmonary HTN, dilated pulmonary artery (PA).
 S2 (P2) is
  with pulmonary stenosis (PS).
Single S2
 A2 is absent with severe AS.
 P2 is absent with chronic obstructive pulmonary disease (COPD) and obesity (inaudible sound due respiratory noise) or PS, pulmonary atresia, right ventricular outflow tract (RVOT) obstruction, and Tetralogy of Fallot.
 A2-P2 occur together with aging due to decreased inspiratory delay of P2.
Splitting
Normally A2 and P2 separate during inspiration and come together during expiration (physiologic splitting) (Fig. 2.4). This occurs due to  pulmonary vascular impedance and relatively longer RV ejection period relative to LV ejection period.
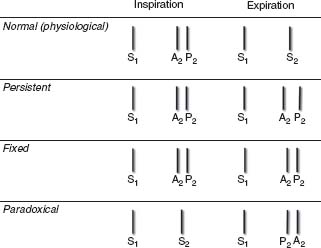
FIGURE 2.4 Illustration of normal S2 (physiologic) splitting and pathologic S2 splitting (persistent, fixed, paradoxical) with the changes that occur as a result of the respiratory cycle. With normal physiologic splitting, P2 closure occurs later than A2 closure during inspiration with associated increased preload and a longer right ventricular ejection period. During expiration, a single S2 sound is heard. With persistent splitting, A2 and P2 are heard throughout the respiratory cycle but separated by a wider distance during inspiration. This is due either to a delay in the closure of P2 or an early closure of A2. Fixed splitting may occur with hemodynamically significant ASDs and describes the equal and persistent separation of A2 and P2 during the respiratory cycle. Paradoxical splitting is the opposite of normal splitting (P2 precedes A2) during expiration, and a single sound is heard during inspiration. This is due to either a delay in A2 closure or an early P2 closure.
 Splitting of the S2 may be physiologic or pathologic.
Pathologic splitting:
a. Fixed splitting—wide and persistent splitting that remains unchanged throughout the respiratory cycle
Conditions—ASD (~70% secundum ASD when hemodynamically significant), RV failure (most common cause in adults), PS, Partial anomalous pulmonary venous return (usually with sinus venosus ASD), ventricular septal defect (VSD) with left-to-right shunt (A2 closure is early)
b. Persistent splitting—splitting occurs with both inspiration and expiration but is not fixed with a further widening occurring with inspiration.
 Conditions:
1. P2 delayed—RBBB, pulmonary HTN, RV dysfunction, PS, dilated PA
2. A2 early—severe MR, VSD, Wolf–Parkinson–White (WPW) (LV pre-excitation)
c. Paradoxical splitting—the normal sequence of A2 followed by P2 closure is reversed so that so that with expiration P2 precedes A2 and with inspiration the sounds come together.
 Conditions:
1. A2 delayed—LBBB or RV pacing, AS, LV dysfunction, HCM, Dilated aorta or Ischemia
2. P2 early—WPW (RV preexcitation)
THIRD HEART SOUND
Basic Principles
 Physiologic sound in young adults though may disappear with standing. Almost all adults lose S3 after 40 years old.
 It is normal during the third trimester of pregnancy.
 Best heard with light pressure of the bell of stethoscope (low frequency) in the left lateral decubitus position at the apex
 Right-sided S3 can be heard at left sternal border and may
  with inspiration.
 Most commonly heard in conditions of high flow across an AV valves
 S3 follows an opening snap (OS) and pericardial knock (PK) in timing.
 S3 corresponds with the “y” descent of the central venous or atrial waveform or the Doppler E wave on an echocardiogram.
 An S3 is not expected with severe MS.
FOURTH HEART SOUND
Basic Principles
 S4 is usually pathologic (atrial gallop).
 S4 is heard best with the bell of the stethoscope and occurs just before S1, after the P wave on the EKG and is equivalent to the Doppler A wave on an echocardiogram.
 A left-sided S4 is heard best in the left lateral decubitus position at the apex during expiration and a right-sided S4 is heard at the left sternal border to midsternum best with inspiration.
 Common pathologic states associated with a left-sided S4 include—AS, HTN, HCM, and Ischemic heart disease. A right-sided S4 is heard with PH and PS.
 S4 gallop is not heard with AF.
 When S3 and S4 are heard simultaneously such as may occur with tachycardia and prolonged PR intervals, a “summation gallop” (SG) is present.
 A quadruple rhythm with a distinct S3 and S4 may be heard with tachycardia.
EXTRA HEART SOUNDS
Diastole
See Figure 2.5.
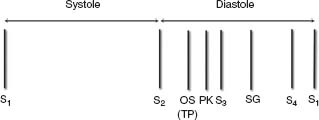
FIGURE 2.5 The relative timing of heart sounds heard during diastole is shown. The earliest sound audible is an OS. A TP related to atrial tumors such as an atrial myxoma occurs at the same time as an OS. A PK present with constrictive pericarditis occurs later than an OS but slightly earlier than an S3 gallop. The PK can be distinguished from an S3 since it is louder and higher pitched. An S4 occurs before the onset of ventricular systole. Sometimes with rapid heart rates, there is a fusion of S3 and S4 to create an SG.
Opening Snap
 Pathologic sound generated by abrupt movement of the body of the mitral leaflets in early diastole due to MS or tricuspid stenosis (TS)
 OS is a high-pitched sound best heard medial to the apex with the diaphragm of the stethoscope.
 If the valve is not mobile or MR is present, an OS may not occur.
 An interval of <70 milliseconds is consistent with severe MS. However, this interval is affected by other factors such as left atrial and left ventricular pressure and compliance.
 S2–OS interval may not be useful with rapid heart rates or with AS, AR, or MR.
 A tumor plop (TP) has about the same timing as an OS.
 A right-sided OS is best heard at the left sternal border and varies with respiration.
Other Diastolic Heart Sounds
 A tumor “plop” occurs at about the same time as an OS. It is due to the movement of a tumor such as a myxoma into the atrium during diastole.
 A PK is best heard with the diaphragm of the stethoscope at the apex and may vary with respiration. It is due to the rapid early left ventricular filling that occurs with constrictive pericarditis.
Systole
See Figure 2.6.
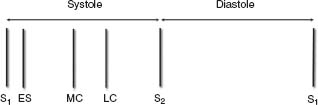
FIGURE 2.6 The relative timing of heart sounds heard during systole is shown. An ES is the earliest systolic sound audible and is heard just after S1 but occurs before the carotid pulsation. Nonejection clicks are usually midsystolic or late systolic and are most commonly caused by MVP. MC, midsystolic click; LC, late systolic click.


