Cardiac MRI and CT
Cardiac magnetic resonance imaging (MRI) and computed tomography (CT) are noninvasive imaging modalities with clinical utility in a wide array of cardiovascular diseases. Common indications, technical considerations, and specific clinical scenarios are reviewed, with attention to the essential knowledge base that might be expected of fellows completing a general cardiovascular medicine fellowship.
CARDIAC MRI
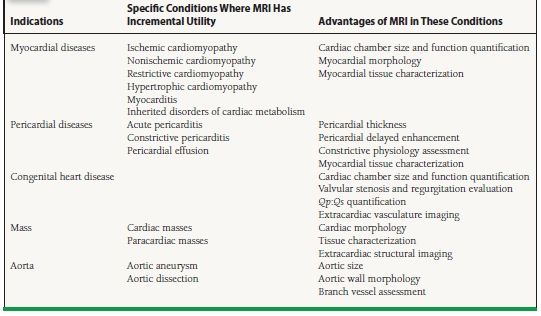
Recent advances in pulse sequence design and scanner hardware have permitted MRI to become a useful tool in the noninvasive assessment of cardiovascular diseases. MRI provides high-resolution anatomic images; quantitative assessment of ventricular function as well as myocardial mechanics, perfusion, and viability; quantification of intra- and extracardiac shunts; measurements of valvular velocities and gradients; and contrast-enhanced angiography without the use of ionizing radiation or nephrotoxic contrast agents. Table 14.1 summarizes the indications of MRI in cardiovascular medicine, in particular drawing attention to the advantages of MRI in the assessment of these conditions.
TABLE
14.1 Indications of MRI in Cardiovascular Diseases
Technical Considerations
MRI Physics
The nuclei of all atoms are composed of one or more protons. Protons have a small positive electric charge and spin at a rapid rate. The rapid spinning motion of a positively charged proton produces a small but measurable magnetic field that in a sense is similar to a tiny bar magnet. Normally, the magnetic fields of these protons are randomly oriented throughout the body. When they are placed within an MRI scanner, however, protons within the body align themselves with the external magnetic field of the scanner, just as a compass aligns with the earth’s magnetic field. By applying radiofrequency (RF) waves, a portion of these protons can be made to change their alignment to a more excited state. As these protons relax and return to their original alignment, they emit a signal that can be measured and used to generate a clinical image. Hydrogen (1H) is the most abundant atom in the body and forms the basis of MRI imaging.
Basic Imaging Sequences
Imaging in MRI depends on using gradient coils within the scanner to send RF pulses in specific patterns to stimulate the 1H protons within the body. As these protons relax, they emit signals that are detected by receiver coils placed over the body, perpendicular to the main magnetic field of the scanner. Signal localization within the body is achieved by applying varying frequency and phase gradients along orthogonal planes. Image contrast is determined by variations in relaxation time (T1, T2, and T2*) of the different atoms that make up the tissues or organs of interest.
Pulse sequences are combinations of different types of RF pulses that result in different “weighting” toward one type of relaxation versus another (e.g., T1 weighting, T2 weighting). T1-weighted images are the basis of delayed enhancement imaging where contrast between fibrosed tissues with retained gadolinium and normal tissues are highlighted. T2-weighted images are useful for evaluation of tissue edema after a myocardial infarction, myocarditis or certain inflammatory conditions, such as Takayasu arteritis. T2* weighting, though rarely used, is helpful in iron overload conditions such as hemochromatosis or hemosiderosis.
The most common types of pulse sequences used in cardiac MRI are as follows:
 Spin echo or “black blood” images. These pulse sequences are designed so that flowing blood produces no signal and appears dark (Fig. 14.1). However, because of the time for the inversion pulses to saturate the signal of flowing blood and the T2 weighting, spin echo pulse sequences usually produce still images. These pulse sequences provide good tissue contrast and anatomic detail, making them useful for visualizing morphology. Myocardium has an intermediate signal intensity on spin echo images, whereas fat and cerebrospinal fluid have high signal intensity (i.e., they appear bright).
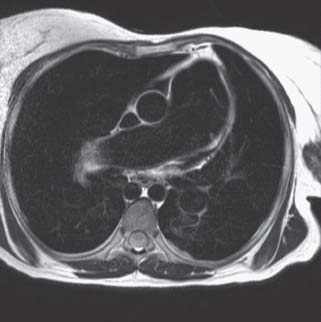
FIGURE 14.1 Axial spin echo image at the level of the pulmonary artery of a patient with an atrial septal defect (ASD) and Eisenmenger syndrome. Moving blood is black, whereas myocardium and fat have an intermediate and high-signal intensity, respectively. Note the prominence of the main and right pulmonary arteries, suggesting pulmonary arterial hypertension.
 Gradient echo or “white blood” images. Gradient echo sequences, including steady-state free precession (SSFP) sequences, are commonly used for cine sequences, as the short repetition times permit acquisition of sufficient data throughout the cardiac cycle with high temporal resolution, at 20 to 50 ms (Fig. 14.2). Flowing blood appears bright on gradient echo sequences as fresh unsaturated spins of flowing blood have high signal intensities. White blood images are useful for visualizing cardiac function as well as turbulent flow due to valvular disease or intracardiac shunts.
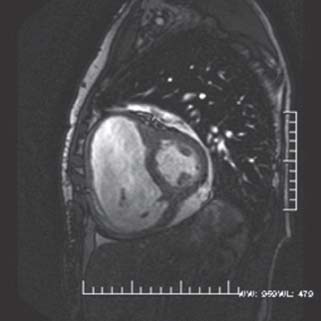
FIGURE 14.2 Still frame from a gradient echo short-axis cine loop of the same patient in Figure 37.1. Note the bright, “white blood” appearance of the blood pool within the left and right ventricular cavities. The RV is severely enlarged and, on cine images, has moderately reduced systolic function. In addition, a small pericardial effusion is present.
 Phase-contrast velocity-encoded imaging. As hydrogen nuclei move through a magnetic field gradient, they acquire a particular phase shift proportional to the velocities at which they are moving through the field gradient. Phase-contrast imaging is analogous to Doppler imaging in echocardiography and is used to quantify both the velocity and flow of blood through an area of interest. Blood flow is quantified by multiplying the cross-sectional area of a particular vessel (e.g., the ascending aorta) and the integral of the velocities in the region of interest. Accurate velocity and flow quantification allows the estimation of gradients across valves, regurgitant volumes, as well as shunt fractions such as Qp/Qs ratios (Fig. 14.3).
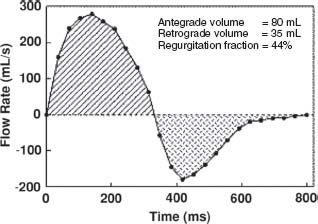
FIGURE 14.3 Flow curve obtained from phase velocity images of the pulmonary artery in a patient with surgically palliated tetralogy of Fallot. Forward and regurgitant volumes as well as regurgitant fractions can be calculated, which in this case suggests moderate pulmonic insufficiency.
 Magnetic resonance angiography (MRA). MRI gadolinium-based contrast (most commonly gadolinium DTPA) is an extracellular agent that influences the magnetic property of adjacent tissue. Contrast shortens the T1 relaxation times and appears bright on T1-weighted sequences. It allows better visualization of the cardiac and extracardiac vasculature. Gadolinium-based contrast agents have the advantage of being nonnephrotoxic and have a very low incidence of adverse events compared with contrast dyes used in x-ray angiography or CT. However, the concern over nephrotoxic systemic fibrosis limits the use of gadolinium based contrast in patients with chronic renal failure.
 Perfusion imaging. First-pass tracking of MRI contrast bolus allows the evaluation of myocardial perfusion. When performed with stress conditions, most commonly with vasodilator stress such as adenosine, but also dobutamine, ischemia and infarction can be assessed, similar to perfusion imaging protocols used in nuclear medicine.
 Delayed enhancement imaging. In areas of scarred or fibrotic myocardium, there is an expansion of interstitial space where gadolinium is retained, after the initial contrast injection. The delayed wash-out of gadolinium makes fibrotic areas appear as bright or “hyperenhanced” when myocardium is imaged 10 to 15 minutes after contrast injection (Fig. 14.4). A special inversion pulse is applied prior to main read-out sequence timed to “null” the signal intensity of normal myocardium, so that the contrast with fibrotic tissues is maximized. Specific patterns of hyperenhancement correspond with certain cardiovascular diseases, as described below.
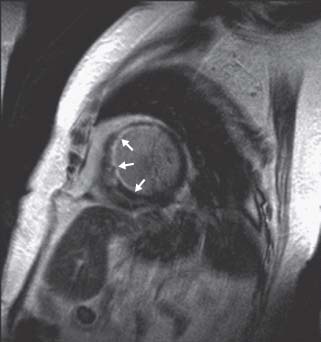
FIGURE 14.4 Delayed hyperenhancement short-axis image acquired 10 minutes after the injection of gadolinium DTPA in a patient with multivessel coronary artery disease. An optimal inversion time (TI) was used in this image to “null” (darken) normal myocardium and accentuate (white) areas where gadolinium has remained in the interstitium on a “delayed basis” (delayed hyperenhancement). Note the hyperenhanced area along the subendocardial anteroseptal wall (white arrow), as well as patchy areas of hyperenhancement in the midinferoseptal and inferolateral walls.
Cardiac MRI imaging is usually performed during periods of 10 to 15 second breath holds to minimize respiratory movement. Cardiac gating with electrocardiography is done using MRI-compatible electrodes, aggregating data from multiple cardiac cycles to generate a single image or a single cine loop. Respiratory gating or triggering can be used in pulse sequences that require data from more cardiac cycles than can be fitted within one breath hold. Free-breathing acquisitions are sometimes used for real-time imaging of the heart when patients are unable to hold their breath, although spatial and temporal resolutions are limited in these acquisitions.
MRI-compatible equipment is used for monitoring patient’s blood pressure, heart rate, cardiac rhythm, respiration, and oxygen saturation inside the scanner.
Selected Clinical Applications
Viability Assessment
Delayed hyperenhancement imaging delineates of areas of acute and chronic myocardial infarction. Areas of both acute and chronic myocardial infarction appear bright (hyperenhanced) on delayed images postgadolinium administration. Such areas typically begin at the subendocardium and extend at a variable depth toward the epicardium, depending on the transmurality of the infarction. These hyperenhanced areas occur within a coronary distribution, unlike other causes of hyperenhancement such as sarcoidosis or myocarditis.
Hyperenhancement in acute infarction is due to disruption of myocardial membranes, which permits the diffusion of contrast agent into the expanded extracellular spaces. Hyperenhancement in chronic infarction is the result of the expanded interstitial space from the collagenous scar tissue allowing contrast to accumulate with slow wash-out, thereby appearing bright on delayed images. Areas of acute infarction appear bright on T2-weighted spin echo images due to local tissue edema, permitting one to differentiate between an acute and chronic infarct.
In patients with coronary artery disease and left ventricular dysfunction, the distinction between viable and nonviable myocardium may be important in determining the strategy of revascularization. Patients with viable myocardium are more likely to have an improved left ventricular ejection fraction and survival after revascularization. The extent of transmural hyperenhancement by cardiac MRI has been shown to predict both improvement in myocardial contractility and survival after coronary revascularization in patients with ischemic cardiomyopathy, and is thus used as a measure of myocardial viability. Myocardial segments with 25% or less transmural hyperenhancement are considered viable, whereas segments with 75% or greater transmural hyperenhancement are considered nonviable. Segments with 25% to 75% of transmural hyperenhancement have an intermediate likelihood of functional recovery after revascularization. The likelihood of functional recovery of these intermediate segments is often determined by the number of adjacent segments with either nonviable (75% to 100% transmural hyperenhancement) or viable (0% to 25% transmural hyperenhancement) myocardium.
Coronary Artery Disease
Visualization of the coronary arteries by MRI is technically challenging because of the small size of the coronary arteries, vessel motion during ventricular systole, and limited acquisition time. Coronary imaging with either MRA or three-dimensional SSFP sequences is a useful tool in the assessment of anomalous origin of the coronary arteries (Fig. 14.5). However, due to the abovementioned limitations, assessment of coronary artery stenosis, smaller caliber vessels, and coronary stent patency remains difficult.
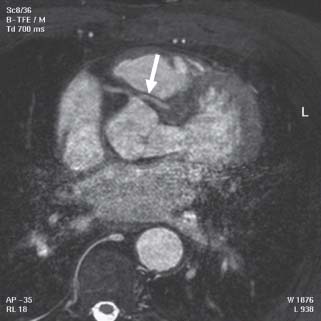
FIGURE 14.5 Gradient echo axial image of an anomalous left coronary artery arising off the right sinus of Valsalva (white arrow) and passing between the pulmonary artery and aorta. The right coronary artery (RCA) arises normally. Note the motion artifact in the lower half of the picture
Heart Failure
MRI is the “gold standard” technique for the evaluation of left and right ventricular volumes, mass, and ejection fraction. Standard gradient echo cine images accurately assess for volumes, systolic function, regional wall motion abnormalities, ventricular aneurysm, and pseudoaneurysm. Other MRI techniques including delayed enhancement and stress perfusion imaging differentiate between ischemic and nonischemic etiologies of heart failure.
Myocardial Disease
Dilated Cardiomyopathy MRI accurately quantifies the degree of ventricular dilatation and ventricular dysfunction in dilated cardiomyopathy. Typically, delayed enhancement images demonstrate either no fibrosis or midmyocardial fibrosis not fitting a coronary artery territory. Resting perfusion sequences are normal.
Hypertrophic Cardiomyopathy Hypertrophic cardiomyopathy is primarily assessed by echocardiography but MRI has definite incremental values because of its superior image quality and ability to demonstrate myocardial fibrosis. MRI excels in characterizing the morphology of the disease and quantifies the degree, extent, and distribution of hypertrophy. The complex relationship between the septal hypertrophy, left ventricular outflow tract, mitral valve leaflets, subvalvular apparatus, and papillary muscles is accurately demonstrated, so that atypical cases of hypertrophic cardiomyopathy with concurrent mitral valve leaflet abnormalities and papillary muscle abnormalities can be identified. The accurate visualization of anatomical relationships also makes MRI crucial for premyectomy or preablation planning. In addition, MRI may also have a role in screening for preclinical disease because of the sensitivity of the technique.
Myocardial fibrosis demonstrated on delayed hyperenhancement imaging has potential prognostic value. A distinct pattern of midmyocardial hyperenhancement is noted in hypertrophic cardiomyopathy, affecting most commonly the hypertrophied septum, but also right ventricular free wall insertion points into the interventricular septum and other areas. The presence of myocardial hyperenhancement correlates with clinical markers of sudden cardiac death, as well as detection of ventricular arrhythmia on Holter monitoring. Recent longitudinal studies suggest an association between hyperenhancement and sudden cardiac death.
MRI helps in the differential diagnosis of cases that mimic hypertrophic cardiomyopathy such as physiologic hypertrophy of an athlete’s heart and hypertensive heart disease. Fabry disease, an X-linked recessive disorder of lysosomal targeting enzymes, accounts for as much as 5% of all cases of presumed hypertrophic cardiomyopathy and can be identified by marked left ventricular hypertrophy and the distinct basal inferolateral delayed hyperenhancement with sparing of the subendocardium. Identification of these patients guides treatment, usually with intravenous α-galactosidase replacement therapy.
Restrictive Cardiomyopathy MRI can help distinguish among various etiologies of restrictive cardiomyopathy, as well as differentiate between restrictive cardiomyopathy and constrictive pericarditis.
 Cardiac amyloidosis. Spin echo and gradient echo images demonstrate increased thickness of the left and right ventricular myocardium, and occasionally of the atrial walls and atrioventricular valves. Systolic function is usually preserved or mildly impaired, although abnormal diastolic relaxation may be evident on myocardial tagging. Delayed hyperenhancement images demonstrate a diffuse enhancement of the left and occasionally right ventricle (RV). Such hyperenhancement may be predominantly subendocardial, but usually the global pattern of myocardial hyperenhancement distinguishes amyloidosis from coronary artery disease. In addition, appropriate nulling of the myocardium with an inversion recovery prepulse on delayed hyperenhancement images may be difficult with amyloidosis due to both the global shortening of T1 relaxation time in the amyloid affected myocardium and the early wash-out of gadolinium, from the bloodstream.
 Cardiac sarcoidosis. Cine gradient echo images may demonstrate normal or impaired left ventricular systolic function, often with regional wall motion abnormalities. The extent and distribution of sarcoid involvement of the heart vary. In the early stages of sarcoidosis, the myocardium may demonstrate patchy high signal intensity on T2-weighted black blood images as a result of localized inflammation, along with focal patchy areas of hyperenhancement in a noncoronary distribution. Patchy hyperenhancement corresponds to areas of noncaseating granulomas that are the typical histologic findings of sarcoidosis. In more severe cardiac sarcoidosis, areas of hyperenhancement are also seen, along with ventricular wall thinning and aneurysms, most commonly along the basal anteroseptal wall.
 Hemochromatosis. These patients present as dilated cardiomyopathy on cine gradient echo images, with evidence of reduced myocardial contractility on cine-tagged images. Due to tissue iron accumulation leading to local field inhomogeneity, signal loss is seen in both the myocardium and the liver on T2*- weighted spin echo sequences.
Arrhythmogenic Right Ventricular Cardiomyopathy
Arrhythmogenic right ventricular cardiomyopathy (ARVC) presents with right ventricular enlargement and/or decreased right ventricular dysfunction. Right ventricular dysfunction can be diffuse in advanced ARVC, or limited to areas of “scalloping” or bulging of the right ventricular free wall with associated akinesis or dyskinesis. Small saccular aneurysms appear as nipple shaped projections off the right ventricular free wall and right ventricular outflow tract (RVOT). Fibrofatty infiltration can be seen on spin echo images as areas of high signal intensities, which suppresses fat-saturation sequences. These areas appear bright on delayed hyperenhancement images.
On the latest task force criteria on ARVC in 2010, cardiac MRI is one of the imaging modalities for documenting global/regional dysfunction/structural alterations (Table 14.2). While fibrofatty replacement of the myocardium is considered a major criterion for the diagnosis of ARVC if detected on biopsy specimens, diagnostic criteria for MRI have not been incorporated into task force recommendations as yet.
TABLE
14.2 Imaging Criteria for Diagnosis of ARVC
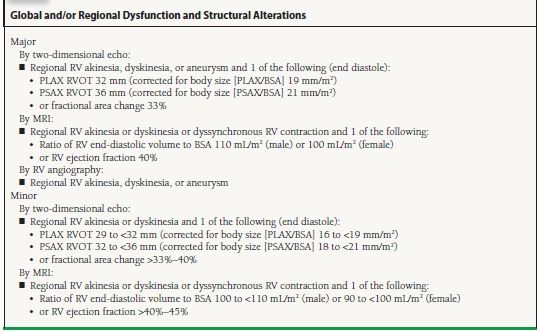
From Marcus FI, McKenna WJ, Sherill D, et al. Diagnosis of arrhythmogenic right ventricular cardiomyopathy/dysplasia: proposed modification of the task force criteria. Circulation. 2010;121:1533–1541, with permission.
Constrictive Pericarditis
MRI is excellent for both the morphologic and functional assessment of constrictive pericarditis and other pericardial disease. T2-weighted spin echo sequences demonstrate pericardial thickening, as well as the presence of pericardial effusion. The normal pericardium is typically <2 mm in thickness and is often thickest over the right ventricular free wall. In constriction, pericardial thickness is usually >3 to 4 mm. Pericardial calcification is more difficult to demonstrate on MRI compared to CT, because of signal loss on MRI in areas of calcifications. Indirect signs of constriction can be seen in atrial enlargement, systemic and pulmonary vein enlargement.
Functional assessment of pericardial diseases by MRI demonstrates the presence/absence of constrictive physiology, which includes diastolic bounce of the interventricular septum, diastolic restraint, tubular or conical-shaped narrowing of one or both ventricles, and pericardial tethering. These can be seen in standard cine gradient echoes. Myocardial tagging images can also demonstrate pericardial tethering to the adjacent myocardium, rather than the normal free sliding of the myocardium over the pericardium in healthy hearts. In addition, ventricular interdependence can be demonstrated on free-breathing gradient echo cine sequences where the interventricular septum is seen to shift toward the left ventricle during inspiration. The characteristic septal shift is often most prominent on the first heartbeat that follows the beginning of inspiration.
Aortic Disease
Aortic Dissection Using a combination of spin echo, gradient echo, and contrast-enhanced MRA images, the thoracic and abdominal aorta can be evaluated for dissection flaps, location of the true and false lumens, entry and reentry intimal tears, involvement of aortic branch vessels, and associated complications (e.g., pleural effusion, cardiac tamponade, aortic regurgitation).
Compared to transesophageal echocardiography, MRI has a similar sensitivity for detection (98% to 100%) but a superior specificity (98% to 100% compared to 68% to 77%) for the diagnosis of aortic dissection. The sensitivity and specificity of MRI and CT are similar. However, an MRI study of the aorta takes much longer than CT, which makes it better suited for nonemergency imaging (e.g., chronic dissection) or in the follow-up of patients after surgical repair.
Intramural Hematoma Noncommunicating intramural hematomas of the aorta are thought to be a form of aortic dissection without intimal rupture or tear. Clinical presentation is similar to typical aortic dissection. On MRI, it appears as a smooth crescentic or circumferential area of aortic wall thickening without evidence of false lumen blood flow.
Aortic Aneurysm A combination of spin echo, gradient echo, and contrast-enhanced MRA images describe the size, location, and extent of a thoracic or abdominal aortic aneurysm. In addition, presence of thrombus, accompanying dissection, involvement of aortic branch vessels, and growth rate can also be accurately documented. MRA sequences can potentially underestimate the size of the aneurysm if there is significant thrombus formation. Effacement of the sinotubular junction may be seen in aneurysms of the ascending aorta and indicate annuloaortic ectasia, conferring a higher risk of aortic rupture. Mycotic aneurysms of the aorta or its branch vessels can be identified by the typical saccular appearance, as well as increased signal intensity of the aneurysm wall on T2-weighted spin echo sequences due to the presence of localized inflammation.
Despite its increasing versatility and robustness, important limitations still remain in cardiac MRI imaging. The electromagnetic forces created by the MRI scanner can induce important thermal and nonthermal effects in some patients. Contraindications to MRI imaging must be identified before the patient enters the scanner (Table 14.3). Nonferromagnetic metallic devices, such as mechanical heart valves, sternal wires, and retained pacing wires after cardiac surgery, are safe to image, although they are often a source of image artifact. Internal orthopedic prostheses (e.g., artificial hip joints) are safe to image.
TABLE
14.3 Contraindications to MRI