(1)
Ospedale Civile di Vigevano, Vigevano, Italy
Atrial Abnormalities
General Considerations
In the past, P-wave anomalies associated with cardiac chamber hypertrophy have been referred to with a variety of terms, which reflected their origins in specific anatomic or physiological alterations of one or both atria. In reality, however, the diverse underlying mechanisms often produced similar, virtually indistinguishable changes at the level of the ECG, and for this reason, the less specific term atrial abnormality, rather than atrial hypertrophy or enlargement, was recommended in 2009 by the American Heart Association Electrocardiography and Arrhythmias Committee, Council on Clinical Cardiology; the American College of Cardiology Foundation; and the Heart Rhythm Society, and it will be used in this chapter.
Atrial abnormalities reflect pressure or volume overload of the atria—the former secondary to obstructed outflow (e.g., mitral valve stenosis), the latter to atrioventricular valve insufficiency or shunting. Regardless of its original cause, the overload tends to develop mixed features over time. The electrocardiographic changes become obvious in the more advanced stages, particularly when there is a combined pressure and volume overload, which causes substantial atrial dilatation capable of augmenting the electric potentials.
Right Atrial Abnormality
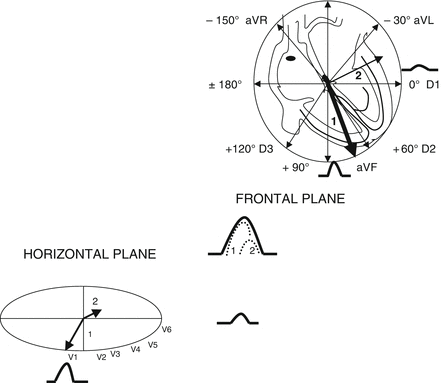
Right atrial abnormality is generally manifested by increases in both the amplitude and duration of the right atrial action potentials. The recorded P wave represents the sum of the right atrial component with that of the left atrium (Fig. 12.1), which begins and ends after the former. For this reason, in the presence of an enlarged right atrium, the amplitude of the P wave is increased but its duration is not appreciably prolonged.


Fig. 12.1
Right atrial abnormality—Increased amplitude of the first component of the P wave in the frontal and horizontal planes. In the frontal plane, the amplitude of the second vector diminishes and that of the first vector increases. Compare P-wave components in a healthy subject shown in Fig. 3.2
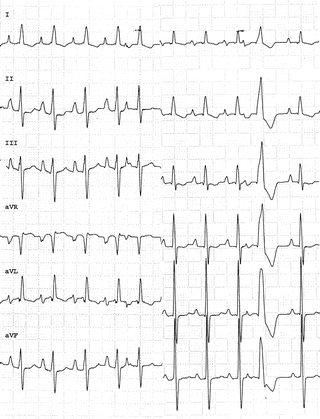
The P waves in leads II, III, and aVF become tall and pointed, with an amplitude of >2.5 mm (Fig. 12.2). In leads V1 and V2, the P wave may be unchanged or it may become pointed (positive or biphasic with predominance of the initial positivity). The right atrial abnormality is sometimes so pronounced that it displaces the right ventricle, which is also dilated in many cases. The QRS morphology varies (QR, Qr, or qR complexes with no evidence of LBBB or prior necrosis).


Fig. 12.2
Patient with primary pulmonary hypertension and right ventricular hypertrophy. The ECG shows a P wave with normal duration (<100 ms) and an amplitude of approximately 4 mm and a biphasic configuration in lead V1 with predominance of the first component
Left Atrial Abnormality
The opposite pattern occurs when the left atrium is involved. The potentials that are amplified (in terms of amplitude and duration) are those related to the second component of atrial activation. As a result, the overall duration of the P wave is increased (110 ms in adults, >90 ms in children), and its morphology reflects predominance of the terminal forces of atrial activation, particularly in lead V1.
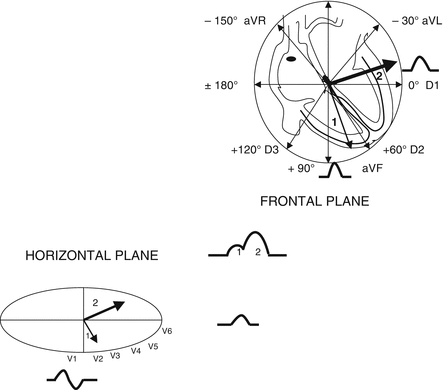
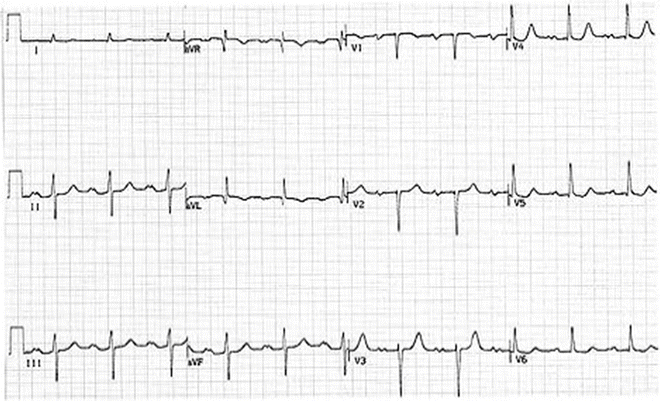
The main P-wave abnormalities are left axis deviation (P-wave axis 0° to +30°), duration of more than 110 ms, a biphasic waveform in V1-V2 with predominance of the terminal negativity, a notched waveform in leads I, II, and aVL with an amplitude increase in the second component (the so-called P-mitrale) (Fig. 12.3). In addition to their increased duration, the P waves recorded in leads II, aVF, V3, and V4 are widely notched with peaks separated by 40 ms or more (Fig. 12.4).


Fig. 12.3
Left atrial abnormality—Alteration of the second component of the P wave, which is predominant in both the frontal and horizontal planes

Fig. 12.4
Patient with mitral valve disease: The ECG shows P waves with a duration of 120 ms, notching in the limb leads, and predominance of the negative component in V1
Combined Right- and Left-Atrial Abnormality
In this case, the ECG changes will be a combination of the alterations discussed above. In leads I, II, and aVL, the P waves will be widely notched (as they are in left atrial abnormality), and the initial component will be tall and pointed (reflecting right atrial abnormality). Lead V1 may record a biphasic P wave with accentuation of the positive initial component (right atrial abnormality) and of the negative terminal component (caused by left atrial abnormality).
Stay updated, free articles. Join our Telegram channel

Full access? Get Clinical Tree


