Fig. 6.1
Pulmonary artery or “Swan-Ganz” catheter
Once venous access is obtained, the catheter is advanced with the balloon inflated to the right atrium, then the right ventricle, the pulmonary artery, and finally into a pulmonary capillary wedge position. Advancing the catheter can be done under fluoroscopy, or by simply watching the pressure tracings as they transition from each chamber of the heart until an appropriate wedge tracing is identified. Pulmonary artery catheters are frequently placed in ICU settings where fluoroscopy equipment is not available, but fluoroscopy can be especially helpful in situations where the cardiac anatomy or valvular pathology make passage of the catheter into the pulmonary artery difficult, such as is frequently the case with severe tricuspid regurgitation. The careful use of a guidewire (0.018–0.025 in.) under fluoroscopy is sometimes needed to augment stiffness and achieve correct placement of the catheter in the pulmonary artery.
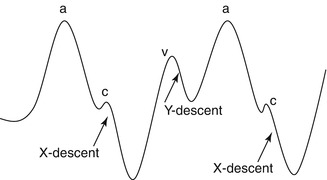
Fig. 6.2
Normal right atrial pressure
As the catheter passes first into the right atrium, a normal pressure waveform should be identified (Fig. 6.2). The a-wave represents atrial contraction, followed by the x-descent as the atrium relaxes. The c-wave represents the period of brief, isovolumetric contraction of the right ventricle where the tricuspid valve briefly bows upward under RV systolic pressures, prior to the opening of the pulmonic valve, at which point the RV empties and the tricuspid pulls away from the RA allowing the x-decent to continue. The v-wave represents venous return to the RA as the pressure gradually rises. Finally, the y-decent represents passive filling of the RV due to opening of the tricuspid valve, just prior to atrial contraction. The easiest way to correctly identify the a-wave is to note that it occurs slightly after the p-wave on the EKG.
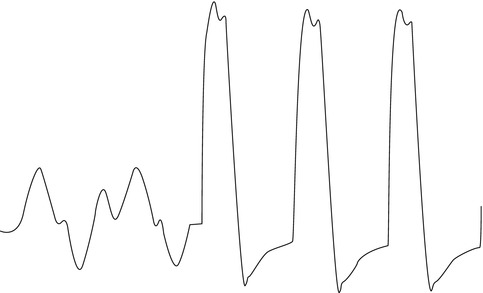
Fig. 6.3
Normal right atrial to right ventricular pressure
As the catheter passes into the RV, an obvious change in the pressure tracing will be noted as systolic pressures rise (Fig. 6.3). RV end-diastolic pressure should closely approximate the mean RA pressure, and should be measured at the end of diastole, just prior to isovolumetric contraction.
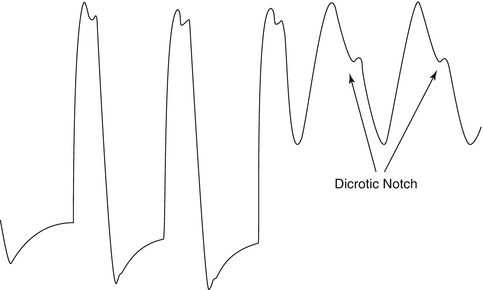
Fig. 6.4
Normal right ventricular to pulmonary arterial pressure
Just like the pressure waveform that is measured in the systemic arterial circulation, the pulmonary artery waveform will have a rise in pressure during systole, followed by a gradual decrease in pressure during diastole (Fig. 6.4). Systolic pressure should closely approximate RV systolic pressure. A dicrotic notch during diastole occurs at the time of closure of the pulmonic valve, and interrupts the otherwise smooth descent of the pressure tracing. This is analogous to the dicrotic notch seen in an arterial line tracing due to closure of the aortic valve.
Once the balloon passes distally enough in the pulmonary artery to completely occlude the vessel, the pressure transducer will no longer be able to measure the normal pulmonary artery pressures waveforms behind it. At this point, a continuous column of blood exists between the tip of the catheter, through the pulmonary capillaries, and all the way through the pulmonary veins. Thus, once in correct wedge position, the hemodynamic tracing will approximately transduce the pressure waveform of the left atrium. Understanding this phenomenon will help one to troubleshoot when the waveform does not appear as would be expected. One common mistake is made when the catheter is incompletely in a fixed position, and the tracing represents partial wedge and partial pulmonary artery pressures. When this happens, it can be helpful to wedge the catheter under fluoroscopy, as the normal systolic and diastolic movement of the balloon will terminate, and the balloon will hold its position when correctly wedged. Another way to confirm that the catheter is in a correct position (although it is very rarely required) is by the very slow and careful drawing back of blood from a wedged catheter. Checking the oxygen saturation of this blood should reveal a normal arterial concentration (as it is drawn back across the capillaries from the pulmonary veins). Pressure tracings of the left atrium will appear similar to that of the right atrium, other than being somewhat higher. A PCWP tracing will differ somewhat from a directly measured left atrial pressure due to the column of fluid that separates the two, and this often leads to dampening of the waveform and a larger delay between events seen on the EKG and events measured on the pressure waveform (i.e. the delay between the p-wave and a-wave will be shorter on the RA tracing and longer on the PCWP tracing).
Given that all of the measurements made during a right and left heart catheterization are done within the thoracic cavity, it is important to remember the normal relationship between intra-thoracic pressures and the respiratory cycle. Frequently, the pressure tracings will rise and fall by a substantial amount during the respiratory cycle, and it is often confusing to decide the correct point to make measurements. The key is to understand that pressures in the thoracic cavity always return to “normal” at the end of expiration. In a person breathing independently, inspiration causes a small amount of negative pressure within the thoracic cavity, and this returns to normal during expiration. In a patient on a positive pressure ventilator though, the opposite will occur, and the pressure will rise as air is forced into the lungs during inspiration, and return to normal during expiration. Thus, measurements should always be taken at the end of expiration, which is the point at which the pressure in the lungs is equal to the pressure in the atmosphere, and is also referred to as the Functional Reserve Capacity (FRC) of the lungs. In patients who are on ventilators with substantial positive end expiratory pressure (PEEP), the measured pressure at end-expiration may slightly over-estimate the patient’s normal physiologic pressures.
Hemodynamic Assessment by Left Heart Catheterization
Routine pressure measurements can also be made in the arterial circulation and in the left ventricle. Systemic arterial blood pressure can be measured peripherally at the site of an arterial sheath or a dedicated arterial line. Pressure can also be measured at the tip of the cardiac catheter as it is placed in the aorta. There are several techniques for crossing the aortic valve with a catheter, but for the purpose of a dedicated hemodynamic study, a pigtail catheter will give the most accurate data.
Using a 0.035 in J-wire, the pigtail catheter is advanced to the aortic valve level. Using a 30° RAO projection, the pigtail should be oriented so that it forms a “6” and faces the aortic valve. From this position, the J-wire should be placed just inside the distal orifice of the catheter, and the catheter advanced. At this point, the catheter may fall easily into the ventricle. More commonly though, the catheter bends upwards until it forms a “9” in the ascending aorta. At this time, slowly withdrawing the catheter may allow it to fall forward through the open valve during systole. In some cases, the catheter may prolapse into the ventricle but the pigtail portion remains above the valve. This can usually be corrected by pushing the J-wire forward briefly, which will stiffen the distal portion of the catheter and advance it. Crossing a stenotic or prosthetic valve will provide additional challenges that may require different catheters and wires, but once successfully inside the left ventricle, a pigtail can typically be placed over an exchange-length wire. Crossing a mechanical valve is rarely attempted.
Normal Pericardial Physiology
In a normal heart the pericardium is relatively non-compliant, and functions to prevent distention of the ventricles, and to couple the ventricles throughout the cardiac cycle. Normally, inspiration leads to a decrease in intra-thoracic pressure, which in turn leads to a decrease in the pressures in the cardiac chambers. Given that the majority of the systemic venous system remains outside the thorax, this leads to a corresponding increase in pressure difference between the vena cavae and the right atrium, and blood return to the heart is augmented. The same is not true for the blood return to the left atrium however as the pulmonary veins are located within the thoracic cavity, so left sided filling remains fairly stable throughout the respiratory cycle. The right ventricle is very compliant, so the increase in volume does not affect the reduction in pressure that is experienced during inspiration, but it does cause the septum to bow slightly toward the LV, causing a small reduction in LV filling and systolic pressure. This normal phenomenon is called a pulsus. Under normal conditions, the effect is small though, and the difference between the highest and lowest recorded systolic pressure over several respiratory cycles should be less than 12 mmHg. Thus, a normal patient will experience a slight decrease in right atrial pressure during inspiration, and the RV and LV pressures should move in concert with each other, demonstrating a slight reduction during inspiration, and rise with expiration.
Hemodynamic Findings of Pericardial Constriction
Many of the hemodynamic findings of pericardial constriction are similar to those found in cardiac tamponade and/or restrictive myocardial disease, so it is important to understand where the differences can be noted. The following section will focus mainly on the hemodynamic changes that are characteristic of pericardial constriction, but will also describe which findings are similar to or different from those seen in other disease processes.
As the pulmonary artery catheter is floated towards the right atrium, the pressure tracing will demonstrate elevated pressures. In the case of cardiac tamponade, external compression of the right ventricle will lead to blunting of the y-descent, as the right atrium is unable to empty quickly during tricuspid valve opening. In severe or late tamponade, there may be loss of normal RA waveforms entirely. This is distinct from the pattern seen in constrictive pericardial disease, characterized by an underfilled RV and a non-compliant atrium, leading to a steep y-decent as the atrium rapidly empties into the RV. Also in constriction, a Kussmaul’s sign can be seen, where there is a paradoxical increase in RA pressure and JVP with inspiration. Engorged abdominal veins empty into the right atrium due to increased abdominal pressure during inspiration, but the constricted heart is unable to accommodate the increase in volume, which results in elevated pressures. This phenomenon is not specific for constriction and may be seen in cases of RV hypertrophy or failure, but is not present in the majority of patients with cardiac tamponade where abdominal veins are not chronically engorged. In general, the hemodynamic findings of restrictive heart disease as measured in the right atrium will be indistinguishable from those of pericardial constriction (Fig. 6.5).
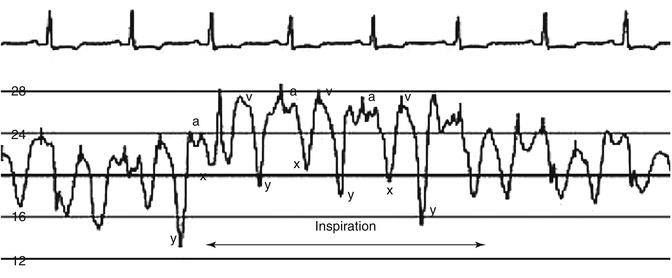
Fig. 6.5
RA Tracing in a patient with pericardial constriction demonstrating a steep y-descent and a positive Kussmaul’s sign
Next, pass the catheter into the RV. In patients with pericardial constriction, there is early rise of the diastolic pressure as the constricted ventricle quickly fills, then a plateau, followed by a normal, sharp rise during systole. This pattern is often referred to as a “square-root sign” because diastole resembles the mathematic symbol (√) for the square root. Also, the RV-end diastolic pressure (mmHg) is usually more than one third of the RV-systolic pressure in the setting of constriction. Tamponade will present with RV diastolic pressures that are elevated, closely approximate the RA and PA diastolic pressures, and the RV pulse pressure may be reduced due to depressed cardiac output. The hemodynamic findings of restrictive heart disease are indistinguishable from constriction in the right ventricle. In general, any condition that leads to impaired diastolic filling of the right ventricle can present with a “square-root” sign (Fig. 6.6).
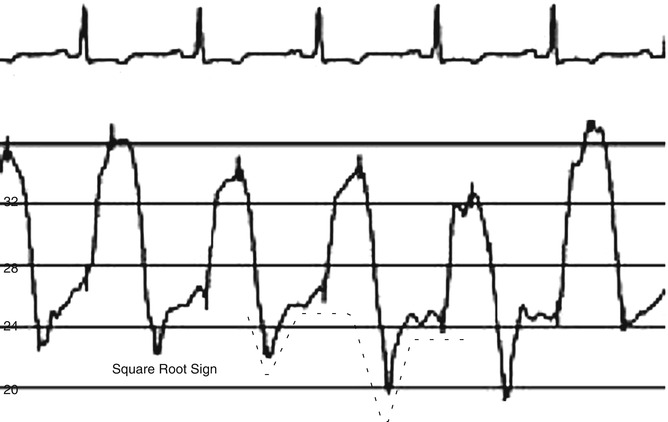
Fig. 6.6
RV Tracing in a patient with pericardial constriction showing the characteristic dip-and-plateau or “square-root” sign
A pulmonary artery and pulmonary capillary wedge pressure should be measured in order to have a complete hemodynamic study. In tamponade, there can be equalization of diastolic pressures across all chambers of the heart, so RA, RV diastolic, PA diastolic, and wedge pressures may all be nearly equal.
The cardiac output and index should be measured while the catheter is in the pulmonary artery. It is important to verify that the cardiac output and index are normal prior to a study to evaluate for pericardial constriction because low output states may interfere with the study. Cardiac output and index may be measured by thermodilution or by the Fick formula for calculating cardiac output:
An accurate Fick calculation requires an accurate measurement of oxygen consumption (VO2), which can be completed in many catheterization laboratories using a metabolic or respiratory analyzer. If a measured VO2 is not available, it can be estimated, but this can result in substantial error. Some of the most simplified methods for estimating VO2 include using the patient’s weight in kg and multiplying by 3, or taking the BMI and multiplying by 125 to give a value that is reported in mL O2/min. The AV O2 difference is the oxygen content in arterial blood (mL O2/mL blood) minus the oxygen content in the pulmonary artery. As most of the oxygen content is bound to hemoglobin, the full formula for AV O2 difference can be simplified, resulting in the following, simplified calculation: