Cardiac and Paracardiac Masses


Cardiac and Paracardiac Masses


Charles B. Higgins

Karen G. Ordovas


TECHNIQUES


COMPUTED TOMOGRAPHY

Multislice or spiral single-slice CT scans in the axial plane after contrast enhancement are used to identify and determine the extent of masses (Fig. 13.1). For this evaluation, ECG-gated multislice CT acquisitions are not necessary. However, ECG-gated multislice CT is now sometimes used especially for evaluation of an intracardiac mass. Collimation is usually 1.25 to 2.5 mm. Retrospective reconstruction of volumetric data in the sagittal or coronal plane may be useful. Reconstructions in the sagittal and coronal planes are done routinely using the multislice axial data usually with slice thickness of 1.25 mm or less. Positron emission tomography/CT can also be used to indicate the likely malignant nature of intracardiac and paracardiac tumors (Fig. 13.2).


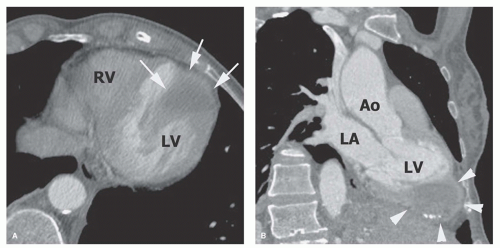
Figure 13.1. (A) Contrast-enhanced CT in the axial plane shows a low-density left ventricular mass involving the apex (arrows). (B) Coronal reconstruction from the CT better demonstrates the relationship of the mass (arrowheads) with the left ventricular apex. Note the peripheral rim of high density with some calcifications surrounding the lower-density central mass (fibroma). LV, left ventricle; LA, left atrium; RV, right ventricle; Ao, aorta.


MAGNETIC RESONANCE IMAGING

ECG-gated transaxial T1-weighted spin-echo (SE) images of the entire thorax are initially acquired for the evaluation of suspected cardiac or paracardiac masses. In addition, such images are frequently acquired in the sagittal or coronal plane to delineate the regions that are displayed suboptimally in the transaxial plane, such as the diaphragmatic surface of the heart. Coronal images facilitate the evaluation of masses involving the aortopulmonary window and pulmonary hili, and mediastinal masses that extend through the cervicothoracic junction. The wide field of view afforded by sagittal and coronal images can readily display the extent of tumors (Figs. 13.3 and 13.4). Contrast between intramural tumor and normal myocardium may be low on nonenhanced T1-weighted images. Transaxial T2-weighted SE images are acquired to enhance the contrast between myocardium and tumor tissue, which usually has a longer T2 relaxation time, and to delineate possible cystic or necrotic components of a mass. The comparison of signal intensities of a mass lesion on T1-weighted and T2-weighted images may to a certain degree allow for tissue characterization. For example, lipomas have relatively high signal intensity
on T1-weighted images and moderate signal intensity on T2-weighted images. Cystic lesions (filled with simple fluid) have low signal intensity on T1-weighted images and high signal intensity on T2-weighted images (Fig. 13.5). The administration of Gd-DTPA (gadolinium diethylenetriamine pentaacetic acid) usually improves the contrast between tumor tissue and myocardium on T1-weighted images and may facilitate tissue characterization. Hyperenhancement of tumor tissue with MR contrast agents indicates either an enlarged extracellular space of tumor tissue in comparison
with normal myocardium (Fig. 13.6) or a high degree of vascularization of the mass. Application of a fat saturation sequence, which vitiates the bright signal of fat, is effective for the tissue characterization of lipomas (Fig. 13.7).


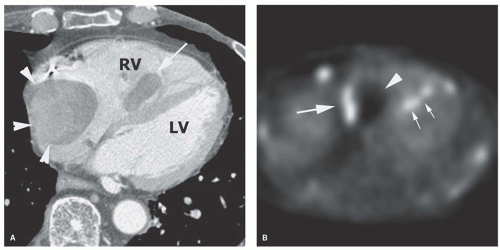
Figure 13.2. A: Axial contrast-enhanced CT image shows a right atrial mass (arrowheads) with a wide point of attachment to the wall. Note a second mass (arrow) within the right ventricle (RV). B: PET scan in the axial plane shows avid uptake of FDG in part of the atrial mass (large arrow) and in the ventricular mass (small arrows) in patient with metastatic thyroid cancer. Note that part of the atrial mass (arrowhead) has no uptake due to tumor necrosis. LV, left ventricle.


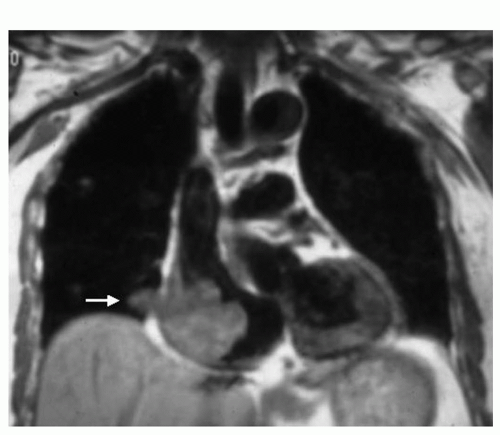
Figure 13.3. Angiosarcoma. ECG-gated spin-echo image in the coronal plane shows a large tumor in the right atrium extending through the atrial wall (arrow). The wide field of view of the coronal plane demonstrates the extent of this angiosarcoma.


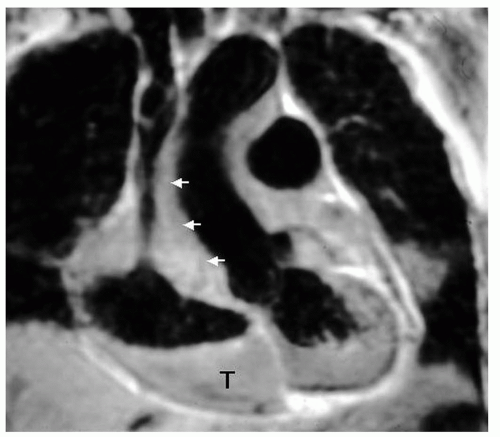
Figure 13.4. Angiosarcoma. ECG-gated spin-echo image in the coronal plane demonstrates a tumor (T) infiltrating through the right atrial cavity and extending around the superior vena cava (arrows).


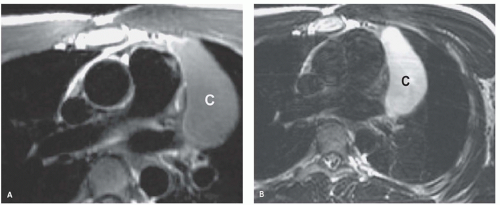
Figure 13.5. Pericardial cyst. ECG-gated spin-echo T1-weighted (A) and T2-weighted (B) images of a pericardial cyst (C). The simple fluid in the cyst has typical low signal on T1-weighted and homogeneous high signal on T2-weighted images.

In patients with cardiac tumors, cine MRI provides valuable information regarding the movement of the cardiac mass relative to cardiovascular structures. Since cine MR images are acquired with gradient-echo or steady-state free precession (SSFP) sequences, a different contrast is obtained than with the SE technique. On SE images, flowing blood appears with low signal intensity, whereas gradient-echo or SSFP images display the blood pool with high signal intensity. Most studies using white blood imaging now use some form of SSFP sequence.


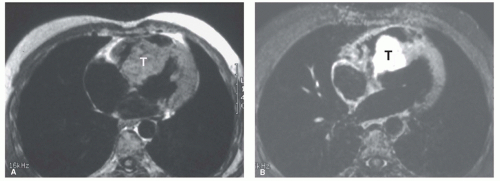
Figure 13.6. Angiosarcoma. ECG-gated spin-echo T1-weighted images before (A) and after (B) gadolinium chelate administration demonstrates hyperenhancement of the tumor (T) compared with the septal myocardium. The postcontrast image uses fat saturation.


LOCATION OF CARDIAC AND PARACARDIAC MASSES

1. Intracavitary

2. Intramural

3. Intrapericardial—outer contour of pericardium with compression of adjacent cardiac chamber

4. Paracardiac or mediastinal (Fig. 13.8)


BENIGN PRIMARY CARDIAC TUMORS

About 80% of primary cardiac tumors are benign (Table 13.1). Although these tumors do not metastasize or invade

locally, they may lead to significant morbidity and mortality by causing arrhythmias, valvular obstruction, or embolism. An intramyocardial location can interfere with normal conduction pathways and produce arrhythmias, obstruct coronary blood flow, or diminish compliance or contractility through replacement of myocardium. Both benign and malignant tumors have characteristic sites of origin (Table 13.2).


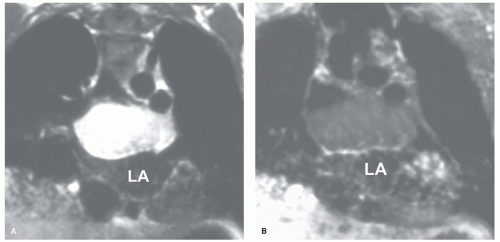
Figure 13.7. Lipoma. ECG-gated spin-echo images in coronal plane, before (A) and after (B) fat saturation, of a mass situated above the left atrium (LA). Signal of the mass is suppressed with fat saturation.


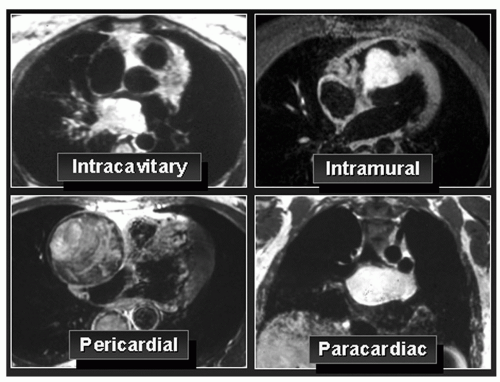
Figure 13.8. Location of masses on tomographic imaging.


TABLE 13.1 Primary Benign Cardiac Tumors


Myxoma


• usually attached to atrial septum


• most frequently in LA


Lipoma or lipomatous hypertrophy of atrial septum


Papillary fibroelastoma


• usually attach to valve (aortic valve most frequent)


Rhabdomyoma


• most common tumor in children


Fibroma


Pheochromocytoma


Hemangioma


MYXOMA


TABLE 13.2 Typical Sites of Origin of Cardiac Tumors


Tumor


Site(s)


• Myxoma


Left atrium 75%; right atrium 20%


• Lipoma


Right atrium; atrial septum


• Papillary fibroelastoma


Aortic valve 30%; mitral valve 2%; pulmonary valve 13%; tricuspid valve 17%


• Rhabdomyoma


Left and right ventricular myocardium


• Fibroma


Right ventricular wall and ventricular septum


• Pheochromocytoma


Peri-left atrium; retroaortic; aorticopulmonary window


• Hemangioma


Any cardiac chamber


• Angiosarcoma


Right atrium, pericardial cavity


• Rhabdomyosarcoma


Ventricular myocardium


• Lymphoma


Right atrium


Myxoma is the most common benign cardiac tumor (8,9). It is located in the left atrium in 75% of cases and in the right atrium in 20% of cases. Very rarely, myxoma occurs in the ventricles. Multiple atrial myxomas may occur rarely, especially in Carney’s syndrome (10). Myxomas are readily shown by contrast-enhanced CT and MRI (11,12,13,14 and 15). This tumor is usually spherical, but the shape may vary during the cardiac cycle because of its gelatinous consistency. Left atrial myxomas are typically attached by a narrow pedicle to the area of the fossa ovalis (Fig. 13.9A). Infrequently, myxomas have a wide base of attachment to the atrial septum (see Fig. 13.9B). However, a wide mural attachment is more frequently encountered with malignant tumors. The extent of attachment may be difficult to assess for large tumors, which fill nearly the entire cavity so that they are compressed against the septum (Fig. 13.9B). As a result, the tumor appears to have broad contact with the atrial septum on static MR images. Myxomas can grow through a patent foramen ovale and extend into both atria, a condition that has been described as a “dumbbell” appearance. Cine MRI permits an evaluation of tumor motion and may help to identify the site and length of attachment of the tumor to the wall or walls of the cardiac chambers (11,12,15). With this technique, myxomas have been shown to prolapse through the funnel of the
atrioventricular valve (Fig. 13.10) or into the corresponding ventricle during diastole. Rarely, myxoma can have a wide point of attachment to ventricular endocardium (Figs. 13.11 and 13.12).


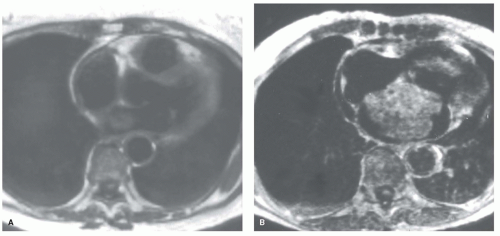
Figure 13.9. Myxomas. ECG-gated spin-echo images display two left atrial myxomas with a narrow point of attachment (pedicle; A) and a wide point of attachment (B) to the left side of the atrial septum.


Figure 13.10. Myxoma. Cine MR images (balanced steady-state free precession) in the axial plane display a right atrial myxoma in diastole (A) and systole (B). The motion of the tumor is evident with movement into the tricuspid valve during diastole.

Usually, myxomas display intermediate signal intensity (isointense to the myocardium) on T1-weighted SE images. On T2-weighted SE images, myxomas usually have higher signal intensity than myocardium. However, myxomas with very low signal intensity have also been observed. Fibrous stroma, calcification, and the deposition of paramagnetic iron following interstitial hemorrhage can vitiate the signal intensity of the tumor on cine MR and spin-echo images. Rarely, myxomas have been reported to be invisible on SE images because of a lack of contrast with the dark blood pool. Such tumors can be delineated with cine MRI, on which they appear with high contrast against the surrounding bright blood. Most myxomas show increased signal intensity after the administration of Gd-DTPA on T1-weighted images (5) (Fig. 13.13) and on delayed gadolinium-enhanced images, which is probably secondary to an increased interstitial space; and therefore, a larger distribution volume of the contrast agent within the tumor than in normal tissue.


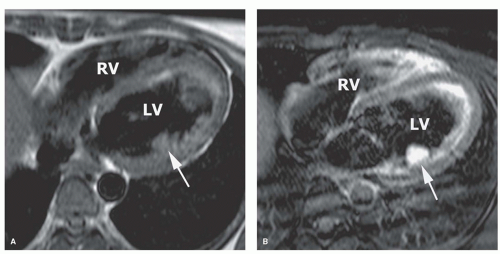
Figure 13.11. Left ventricular myxoma. T1-weighted axial spin-echo images before (A) and after (B) the administration of gadolinium chelate show a tumor (arrow) with a wide point of attachment to the left ventricular (LV) endocardium. Tumor markedly enhances after contrast media. Fat saturation was used after gadolinium. RV, right ventricle.


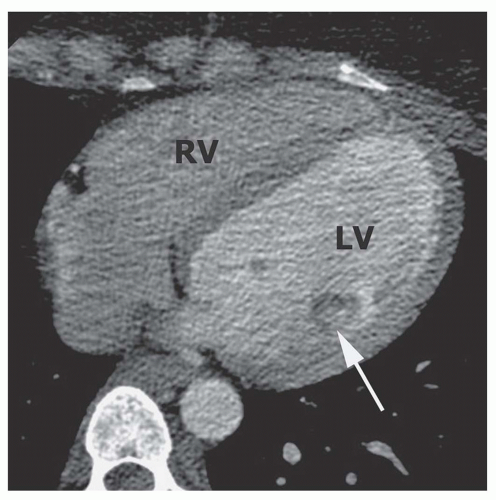
Figure 13.12. Contrast-enhanced CT in the axial plane shows the left ventricular myxoma (arrow) with some enhancement of the central part of the tumor. LV, left ventricle; RV, right ventricle.


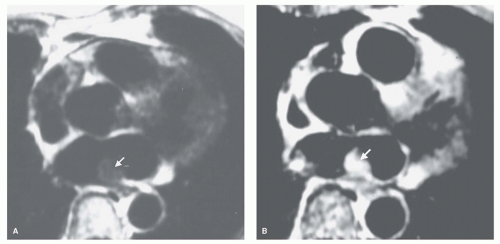
Figure 13.13. Myxoma. ECG-gated spin-echo images of a myxoma before (A) and after (B) gadolinium chelate administration. Tumor (arrows) increases substantially in signal intensity.


LIPOMA AND LIPOMATOUS HYPERTROPHY OF THE ATRIAL SEPTUM

Lipomas are reported to be the second most common benign cardiac tumor in adults but may actually be the most common. If the mass projects into the right atrium, it is called a lipoma, while lipomatous hypertrophy is abundant fat confined to the atrial septum (16,17,18,19 and 20). They may occur at any age but are encountered most frequently in middle-aged and elderly adults. Lipomas consist of encapsulated mature adipose cells and fetal fat cells. The tumor consistency is soft, and lipomas may grow to a large size without causing symptoms. Lipomas are typically located in the right atrium (Fig. 13.14) or atrial septum. Rarely, lipomas may occur in the ventricles (16). They arise from the endocardial surface and have a broad base of attachment. Lipomas have the same signal intensity as subcutaneous and epicardial fat on all MRI sequences (16,17,20). Since fat has a short T1 relaxation time, lipomas have high signal intensity on T1-weighted images, which can be suppressed with fat-saturating pulse sequences (see Fig. 13.14). Usually, they appear with homogeneous signal intensity but may have a few thin septations. They do not enhance after the administration of contrast. On T2-weighted images, lipomas have intermediate signal intensity.

Lipomatous hypertrophy of the atrial septum is considered to be an entity distinct from intracavitary lipoma (17,18,20). Lipomatous hypertrophy of the atrial septum is more common and is alleged to be a cause of supraventricular arrhythmias. Lipomatous hypertrophy is defined as a deposition of fat in the atrial septum around the fossa ovalis that exceeds 2 cm in transverse diameter. It spares the fossa ovalis, a characteristic feature that is clearly delineated with T1-weighted SE images (Fig. 13.15). Lipomatous hypertrophy has the same cellular composition as lipoma but is not encapsulated and infiltrates through the tissue of the atrial septum. It is not a true neoplasm. Fatty tissue may extend from the septum into both atria to a considerable degree. Signal intensity on MRI is similar to that of lipomas.

May 24, 2016 | Posted by in CARDIOLOGY | Comments Off on Cardiac and Paracardiac Masses

Full access? Get Clinical Tree

Get Clinical Tree app for offline access