Inflammatory cytokines released from epicardial fat around coronary arteries may modulate the coronary arteries and promote coronary atherosclerosis. We assessed the hypothesis that epicardial fat volume (EFV) is increased in patients with acute coronary syndrome (ACS). EFV was measured in 80 Japanese patients hospitalized for ACS using 64-multislice computed tomography. The ACS group included 51 patients with ST-segment elevated myocardial infarction and 29 patients with non–ST-segment elevated myocardial infarction. All patients underwent emergency coronary angioplasty and 64-multislice computed tomographic scanning during hospitalization. The control group included 90 consecutive outpatients with suspected ACS whose coronary computed tomographic results were normal. EFV was larger in patients with ACS than in the control group (117 ± 47 vs 95 ± 33 ml, p <0.001). Multivariate regression analysis showed that EFV was associated with age, body mass index, and visceral fat area in the control group. However, these correlations did not appear in the ACS group. Multivariate logistic regression analysis showed that EFV >100 ml was independently associated with ACS (odds ratio 2.84, 95% confidence interval 1.17 to 6.87, p = 0.021). Receiver operator characteristic analysis determined a cut-off value of 100.3 ml with a sensitivity of 75% and a specificity of 60% for ACS (area under the curve 0.692, 95% confidence interval 0.596 to 0.777, p <0.001). Compared to subcutaneous adipose tissue, epicardial adipose tissue showed inflammatory cell infiltrates on a micrograph. In conclusion, the present study demonstrated significantly increased EFV in patients with ACS. A large amount of epicardial fat may be a risk factor for ACS.
An excess of body fat is a well-established risk factor for coronary heart disease. Distribution of body fat varies in patients and may be as important as the amount of body fat in determining risk. Epicardial fat is the local visceral fat of the heart; it is deposited under the visceral layer of the pericardium and may serve as a source of inflammatory cytokines and cells. Inflammation is a main factor in the pathogenesis of atherosclerosis. Thus epicardial fat is considered an important factor in the development of cardiovascular disease because of its close anatomic relation with the coronary arteries. In fact, excess accumulation of epicardial fat is a stronger coronary risk factor than the distribution of other body fat. Evidence is mounting that epicardial fat may also play a significant role in the development of coronary artery disease. Although a relation between epicardial fat volume (EFV) and coronary atherosclerosis has been reported, the amount of epicardial fat in patients with acute coronary syndrome (ACS) has not been studied yet. In contrast, it has been reported that cardiac 64-multislice computed tomography is suitable for the volumetric quantification of epicardial fat, with higher reproducibility than measurements by echocardiography. In the present study we evaluated the EFV in patients with ACS using 64-multislice computed tomography.
Methods
From April 2009 through May 2010, 80 Japanese patients hospitalized for ACS were assessed (mean age 65 years, 77% men). The ACS group included 51 patients with ST-segment elevation myocardial infarction (STEMI) and 29 patients with non-STEMI. Patients were diagnosed with STEMI or non-STEMI as follows. Patients with ischemic chest discomfort, STE on electrocardiogram, and an increase of troponin T level were defined as having STEMI. Patients with ischemic chest discomfort presenting without STE on electrocardiogram but with an increase of troponin T level were defined as having non-STEMI. Coronary angiography was performed in all patients and culprit lesions were determined based on significant stenosis (>90% obstruction) on coronary angiogram. Coronary artery bypass grafting surgery was deemed necessary for 1 patient with stenosis >75% in the left main coronary artery, and the rest underwent percutaneous coronary intervention. All patients also underwent cardiac computed tomographic (CT) examination during hospitalization. The control group consisted of 90 outpatients with suspected ACS (mean age 62 years, 64% men). They underwent coronary CT angiography for evaluation of symptoms of acute chest discomfort. Ninety consecutive patients who had no obstructive stenosis by multislice computed tomography were selected as controls. They did not undergo invasive coronary angiography. Further, we excluded from the control group any patient with previous coronary bypass surgery or coronary artery stenting. This study complied with the Declaration of Helsinki and was approved by the ethics review board of the Nagoya University Graduate School of Medicine. All patients provided written informed consent.
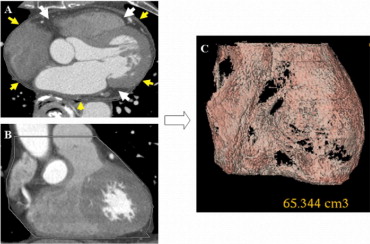
We measured EFV using cardiac CT scanning. Two experienced analysts measured EFV from the obtained images of the heart. CT studies were performed with a 64-multislice CT scanner (LightSpeed, GE Healthcare, Waukesha, Wisconsin). Axial images were reconstructed using prospective electrocardiographically triggered scan acquisition at 70% to 80% of the RR interval with a multidetector system. To avoid motion artifacts, patients with a heart rate >70 beats/min at rest were orally administered atenolol 50 mg at 60 minutes before CT scanning. In the presence of contraindications for a β blocker or an unsatisfactory lowering of heart rate, scanning was performed without atenolol. EFV was defined as the total amount of adipose tissue between the surface of the heart and the visceral layer of the pericardium. Measurements were performed on short-axis views of 3-mm-thick slices ( Figure 1 ) . The stack of short-axis views started at the apex just below the fibrous pericardium and extended to the center of the left atrium. An epicardial area was measured by tracing a single region of interest semiautomatically and epicardial fat on the section obtained at each level. A density range of −190 to −30 HU was used to isolate the adipose tissue. Volume analysis software (Advantage Workstation 4.2, GE Healthcare) was used to discern fat from other tissues. Interobserver variability for the quantification of EFV was <5.0%. In addition to cardiac scans, abdominal scans were obtained at the fourth to fifth lumbar levels. Adipose tissue in each subject was determined from an image taken at the level of the umbilicus. Visceral fat area was defined as intraperitoneal fat, with attenuation ranging from −150 to −50 HU using dedicated software.
Categorical variables are presented as number of patients (percentage) and continuous variables are expressed as mean ± SD. Differences between mean values obtained by the 2 groups (ACS and control) were evaluated using Student’s unpaired t test or Mann–Whitney U test, when appropriate. Multivariate regression analysis was calculated to assess relations between EFV and other clinical parameters (age, gender, body mass index, visceral fat area, high-density lipoprotein cholesterol, low-density lipoprotein cholesterol, triglyceride, and hemoglobin A1c). Moreover, logistic regression analysis was performed to determine whether the association between ACS and EFV was independent of age, gender, and other traditional coronary risk factors. A p value <0.05 was considered statistically significant. All statistical analysis was performed using StatView for Windows (Abacus Concepts, Berkeley, California).
Results
Clinical characteristics of study patients are listed in Table 1 . There were significant differences between the ACS and control groups in high-density lipoprotein cholesterol and low-density lipoprotein cholesterol. Patients with ACS had lower high-density lipoprotein cholesterol levels and higher low-density lipoprotein cholesterol levels. Culprit vessels in ACS were 28 right coronary arteries, 1 left main coronary trunk, 40 left anterior descending coronary arteries, and 11 left circumflex coronary arteries. The average period from diagnosis of ACS to cardiac computed tomography was 10.5 ± 4.3 days.
| Variable | ACS | Control | p Value |
|---|---|---|---|
| (n = 80) | (n = 90) | ||
| Age (years) | 65 ± 12 | 62 ± 11 | 0.128 |
| Men | 62 (77%) | 58 (64%) | 0.060 |
| Body mass index (kg/m 2 ) | 24.7 ± 3.5 | 23.8 ± 3.0 | 0.081 |
| <25 | 42 (53%) | 60 (67%) | 0.061 |
| ≥25 | 38 (47%) | 30 (33%) | 0.061 |
| Current smoker | 33 (41%) | 27 (30%) | 0.129 |
| Systolic blood pressure (mm Hg) | 131 ± 22 | 130 ± 19 | 0.645 |
| Diastolic blood pressure (mm Hg) | 75 ± 12 | 78 ± 13 | 0.171 |
| Visceral fat area (cm 2 ) | 114 ± 55 | 115 ± 61 | 0.947 |
| Triglyceride (mg/dl) | 134 ± 72 | 155 ± 88 | 0.227 |
| High-density lipoprotein cholesterol (mg/dl) | 44 ± 12 | 55 ± 15 | <0.01 |
| Low-density lipoprotein cholesterol (mg/dl) | 128 ± 39 | 116 ± 28 | 0.027 |
| Hemoglobin A1c (%) | 5.9 ± 1.1 | 5.8 ± 1.4 | 0.459 |
| Epicardial fat volume (ml) | 117 ± 47 | 95 ± 33 | <0.01 |
Patients with ACS had significantly larger EFV than patients with normal coronary arteries ( Table 1 ). Table 2 presents associations between EFV and other clinical parameters in the control and ACS groups. In the control group EFV was associated with age, body mass index, and visceral fat area. However, there were no such correlations in the ACS group. Receiver operating characteristic analysis was used to measure the diagnostic performance of EFV ( Figure 2 ) . Area under the curve, which discriminated patients with ACS from those without ACS, was 0.685 (95% confidence interval 0.588 to 0.772, p <0.001). Logistic regression analysis was used to assess the independent association of clinical parameters with ACS. This analysis showed that an EFV >100 ml and high-density lipoprotein cholesterol levels <40 mg/dl were independently associated with ACS ( Table 3 ).
| Variable | ACS (n = 80) | Control (n = 90) | ||
|---|---|---|---|---|
| Beta | p Value | Beta | p Value | |
| Age (years) | 0.10 | 0.418 | 0.28 | <0.01 |
| Men | 0.23 | 0.039 | 0.11 | 0.273 |
| Body mass index (kg/m 2 ) | 0.07 | 0.611 | 0.33 | <0.01 |
| Visceral fat area (cm 2 ) | 0.15 | 0.174 | 0.47 | <0.01 |
| High-density lipoprotein cholesterol (mg/dl) | −0.09 | 0.286 | −0.10 | 0.383 |
| Low-density lipoprotein cholesterol (mg/dl) | 0.13 | 0.455 | 0.12 | 0.279 |
| Triglyceride (mg/dl) | −0.08 | 0.477 | −0.02 | 0.879 |
| Hemoglobin A1c (%) | 0.11 | 0.335 | 0.10 | 0.341 |
| Variable | Univariate | Multivariate | ||
|---|---|---|---|---|
| OR (95% CI) | p Value | OR (95% CI) | p Value | |
| Epicardial fat volume >100 ml | 3.58 (1.90–6.76) | <0.001 | 2.84 (1.17–6.87) | 0.021 |
| Men | 2.40 (1.22–4.70) | 0.010 | 2.43 (0.95–6.20) | 0.061 |
| Median age >63 years | 1.02 (0.99–1.05) | 0.126 | 2.21 (0.91–5.39) | 0.079 |
| Body mass index >25 kg/m 2 | 1.80 (0.96–3.38) | 0.063 | 1.53 (0.57–4.05) | 0.394 |
| Current smoke | 1.72 (0.91–3.26) | 0.092 | 1.64 (0.67–4.01) | 0.277 |
| High-density lipoprotein cholesterol <40 mg/dl | 5.26 (2.22–12.43) | <0.001 | 8.04 (2.19–29.45) | 0.002 |
| Low-density lipoprotein cholesterol >120 mg/dl | 1.36 (0.72–2.55) | 0.338 | 1.35 (0.58–3.14) | 0.445 |
| Hemoglobin A1c >6.5% | 1.96 (0.84–4.55) | 0.116 | 2.25 (0.74–6.81) | 0.151 |
| Visceral fat area >100 cm 2 | 1.41 (0.74–2.68) | 0.288 | 0.52 (0.18–1.47) | 0.220 |
Stay updated, free articles. Join our Telegram channel

Full access? Get Clinical Tree


