A. Kaplan–Meier survival curve
B. Linear regression curve
C. Logistic regression curve
D. Poisson regression curve
E. Correlation curve with Spearman coefficient
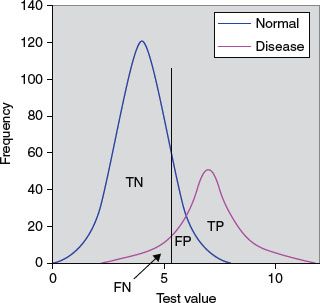
8. Figure 13.2 depicts normal and disease populations with frequency on the y-axis and the diagnostic test value of the x-axis. The cutpoint is indicated by the vertical black line, above which we consider the test to be abnormal and below which we consider the test to be normal. TN is true negatives and TP is true positives. The arrow is pointing at the area that is which of the following?
A. False negatives
B. True negatives
C. Positive predictive value (PPV)
D. Negative predictive value (NPV)
E. Sensitivity/ specificity
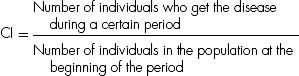
9. A Normal or Gaussian distribution is a well-recognized curve that reflects a continuous probability distribution that is bell-shaped (unimodal) and symmetrical about the mean with two parameters, the mean (μ) and the variance (σ2). Which of the following continuous probability distributions most closely resemble the Normal or Gaussian distribution?
A. The t-distribution
B. The χ2-distribution
C. The F-distribution
D. The binomial distribution
E. The Poisson distribution
10. The mean systolic blood pressure before an antihypertensive medication was given for a group of 50 patients was 165 mm Hg. The mean decrease in blood pressure after the medication was administered was 20 mm Hg. The 95% confidence interval (CI) was −5 to 45 mm Hg. Which of the following statements is correct?
A. The CI can be decreased with a smaller sample of patients
B. One can be 95% confident that the treatment can lower the blood pressure in all patients by at least 20 mm Hg
C. There is a >5% chance that there would be no true change in blood pressure in the entire population
D. The standard deviation (SD) in this study is the same as the CI
E. There is 95% chance that the study sample accurately reflects the general population
11. Of the following, which is a type of inferential statistical method?
A. Arithmetic mean
B. Mode
C. Student’s t-test
D. Median
E. Histogram
12. Which of the following statements regarding hypothesis testing is true?
A. A type I error (α error) occurs when a null hypothesis that is correct is accepted
B. A type II error (β error) occurs when a hypothesis that is incorrect is rejected
C. A type III error is a study design that produces the wrong answer to the right question
D. The P (probability) value is the probability that defines how likely it is that the null hypothesis is false
E. The P value is the probability of an observed difference occurring solely by chance
13. Which of the following would increase the power of a study?
A. Smaller significance level
B. Larger effects
C. Increased variability of the observations
D. Smaller sample size
E. None of the above
14. An economic assessment method is utilized in which the costs and consequences of alternative cardiac interventions are expressed in costs per unit of health outcome. This commonly used methodology is applicable to health programs as well as health services to help determine the preferred action that requires the least cost to produce a given level of effectiveness. Which of the following is this assessment tool?
A. Cost-effectiveness analysis (CEA)
B. Cost–utility analysis (CUA)
C. Cost–benefit analysis (CBA)
D. Cost-minimization analysis (CMA)
E. Cost-value analysis (CVA)
15. A meta-analysis is a technique in which results from a number of studies that are similar in nature are gathered to give one overall estimate of the effect. Which of the following is a disadvantage of this technique?
A. Refinement and reduction of large amount of information
B. Efficiency relative to a new study
C. Publication bias for statistically significant studies
D. Power to detect effects of interest
E. Precision greater than a single study
16. In a prospective study of new antiarrhythmic agent, the investigators found that 16 of 465 children (3.4%) in the treatment group had arrhythmias while in the placebo group, 23 of 465 children (4.9%) had arrhythmias. What is the risk ratio?
A. 1.44
B. 0.44
C. 0.69
D. 0.31
E. None of the above
17. Which of the following is the relative risk reduction (RRR) in this study?
A. 44%
B. 31%
C. 69%
D. 144%
E. None of the above
18. What is the number of patients who need to be treated (NNT) for one to get benefit of the drug?
A. 67
B. 15
C. 20
D. 29
E. None of the above
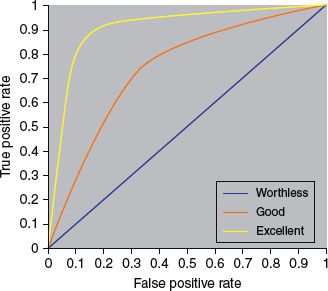
19. In a typical receiver operating characteristic (ROC) curve, what is the significance of the upper left corner or coordinate (0, 1)?
A. 100% sensitivity and specificity
B. 0% sensitivity and 100% specificity
C. 100% sensitivity or 0% specificity
D. 0% sensitivity and specificity
E. 50% sensitivity and 50% specificity
20. The measure of precision of the sample mean or how close the sample mean is likely to be to the population mean is termed as which of the following?
A. Variance
B. Coefficient of variation
C. SD to the mean
D. SD
E. Standard error of the mean (SEM)
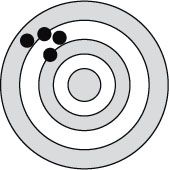
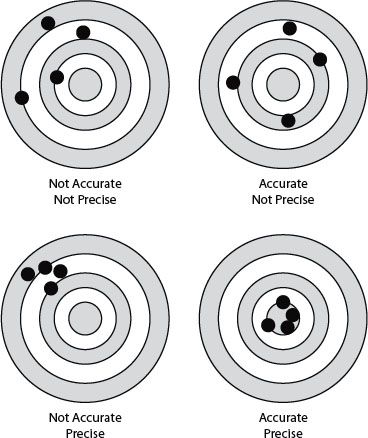
21. Figure 13.3 shows the relationship between accuracy and precision to be which of the following?
A. Accurate and precise
B. Not accurate but precise
C. Accurate but not precise
D. Not accurate nor precise
E. None of the above
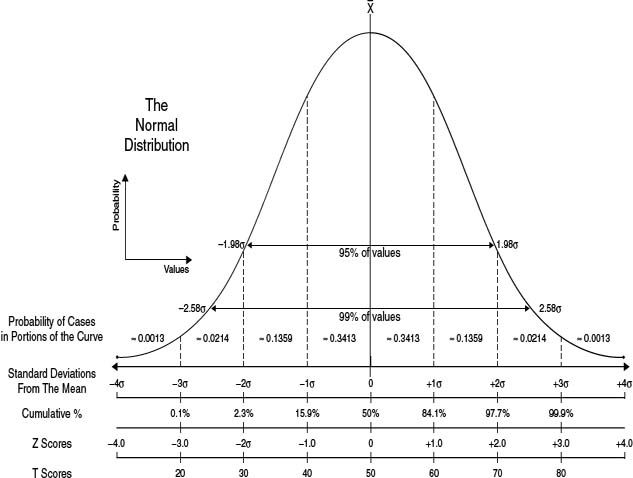
22. Some children with supraventricular tachycardia were treated with digoxin while others were treated with propranolol. The results in a contingency table are shown in Table 13.1.
Table 13.1 Digoxin versus Propranolol for SVT
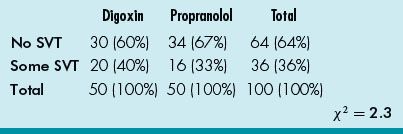
What additional information is necessary for the calculation for P value?
A. Degree of freedom (df)
B. SEM
C. Variance
D. Power
E. Covariance
23. Which of the following statements regarding the correlation coefficient r is true?
A. It is dimensionless
B. When r = 0, there is perfect correlation
C. A correlation between x and y implies that there is a cause and effect relationship
D. The correlation coefficient r can be calculated when there are several outliers
E. A nonlinear relationship does not imply that a correlation coefficient cannot be calculated
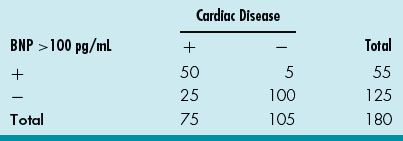
24. A cardiologist reviews the database for elevated (>100 pg/mL) serum BNP in his practice and tabulated the data in Table 13.2 for the cardiac patients he follows or consulted on. What is the PPV for BNP > 100 pg/mL for cardiac disease in his patient population?
Table 13.2 Cardiac Disease and BNP
A. 50/55
B. 50/75
C. 25/180
D. 25/75
E. 50/180
25. For the same database, what is the likelihood ratio (LR)? (Table 13.2)
A. (100/105)/[1–(50/75)]
B. [1–(50/75)]/(100/105)
C. (50/75)/[1–(100/105)]
D. [1–(100/105)]/(50/75)
E. Cannot calculate as prevalence of disease is not stated
26. A randomized controlled trial (RCT) is a trial in which the patients are randomized to receive either the new or a control treatment. An ideal randomization involves equal group sizes, low selection bias, and low probability of confounding (accidental bias). Which of the following is not a refinement of simple randomization?
A. Stratified randomization
B. Blocked randomization
C. Observational randomization
D. Cluster randomization
E. Response-adaptive randomization
27. Bias occurs when there is a systematic difference between the results of a study and the true results. A bias that occurs when a spurious association is noted due to a failure to adjust fully for factors leading to an erroneous conclusion is called as which of the following?
A. Observer bias
B. Confounding bias
C. Selection bias
D. Information bias
E. Allocation bias
28. An association is any relationship between two measured quantities that relates them to be statistically dependent. Which of the following is not a criterion for concluding causation in addition to an association in an observational study?
A. Temporality
B. Dose–response
C. Repetition in a different population
D. Consistency with other studies
E. Expert consensus
29. A pediatric cardiologist is conducting a research project on the use of a new drug for heart failure in children. He is being very truthful to the parent regarding the possible side effect of hypotension with the use of this new drug. He is abiding by which principle of the Belmont report?
A. Respect for persons
B. Beneficence
C. Justice
D. Lack of conflict of interest
E. Scientific reasoning
30. An independent group of experts that continuously monitors the data from various aspects of a clinical trial to ensure patient safety as well as validity and scientific merit of the trial is which of the following?
A. The Institutional Review Board
B. The Ethics Committee
C. The Data Safety Monitoring Board (DSMB)
D. Independent Ethics Committee
E. The Clinical Trials Safety Committee
31. Which of the following is a statistical term to describe the consistency of a set of measurements or a measurement tool or its repeatability and reproducibility?
A. Precision
B. Accuracy
C. Reliability
D. Validity
E. Power
32. A pediatric cardiologist is studying the efficacy of a new antiarrhythmic agent in the treatment of junctional ectopic tachycardia. He is interested in a randomized, double-blind placebo-controlled trial. To calculate the number of patients needed for the study with a power of 0.80 and a statistical significance of 0.05, he needs which additional information?
A. The standardized difference
B. The SEM
C. The CI
D. The bias
E. The expected mean
33. Which of the following statements is an advantage of a cohort study?
A. Not suited for the study of rare diseases because a large number of subjects are required
B. Not suited when the time between exposure and disease manifestation is very long, although this can be overcome in historical cohort studies
C. Exposure patterns, for example, the composition of oral contraceptives, may change during the course of the study and make the results irrelevant
D. Maintaining high rates of follow-up can be difficult
E. Permit calculation of incidence rates (absolute risk) as well as relative risk
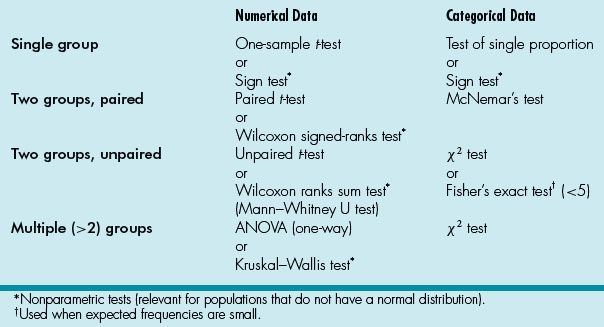
34. A cardiology researcher has a research project and needs to find a statistical method that allows paired comparisons of two non-normal patient populations. Which of the following would be the correct choice?
A. The Wilcoxon signed-rank test
B. The Mann–Whitney U test
C. The Wilcoxon ranks sum test
D. The Kruskal–Wallis test
E. ANOVA
35. Which of the following is a statistical test used for two large (>5) groups of unpaired categorical data?
A. One-way ANOVA
B. χ2 test
C. McNemar’s test
D. Fisher’s exact test
E. Wilcoxon ranks sum test
36. Data can be categorized into categorical or numerical. Which of the following data is an example of a categorical type of data called ordinal data?
A. Severity of AV valve regurgitation
B. Single ventricle and biventricular surgical strategies
C. Blood pressure measurements before and after ACE inhibitors
D. Number of reinterventions after Norwood procedure
E. Antiarrhythmic agent for supraventricular tachycardia
37. A pediatric cardiologist is interested in prospectively studying the relationship between length of time of cardiopulmonary bypass during neonatal surgical palliation and correction of congenital heart disease and fine motor development at ages 5 and 10 years. He will be enrolling neonates in this study. This type of study is called as which of the following?
A. Case–control study
B. Cohort study
C. Case series
D. Retrospective study
E. Historical cohort study
38. A pediatric cardiologist is interested in studying intravenous milrinone in pediatric septic shock and is organizing a randomized controlled multicenter trial involving over 300 children with septic shock in the pediatric intensive care unit setting. He is primarily interested in assessing the benefit of milrinone compared to traditional inotropic agents. This phase of the clinical trial would be considered as which of the following?
A. Phase 0
B. Phase I
C. Phase II
D. Phase III
E. Phase IV
39. A Chi-squared (χ2) test is most closely related to which of the following statistical tests?
A. ANOVA
B. Student’s t-test
C. The Kolmogorov–Smirnov test
D. The Wilcoxon signed rank test
E. The Fisher’s exact test
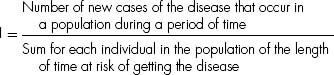
40. The department of public health of a city is interested in knowing the prevalence of congenital heart disease in the city. Which of the following is the correct definition for prevalence of congenital heart disease?
A. Number of new cases of the disease that occur in a population during a period of time/sum for each individual in the population of the length of time at risk of getting the disease
B. Number of individuals who get the disease during a certain period/number of individuals in the population at the beginning of the period X
C. Existing number of individuals having the disease at a specific time/number of individuals in the population at that point in time
D. Number of new cases of the disease that occur in a population during a period of time/number of individuals in the population at the beginning of the period X
E. Number of individuals who get the disease during a certain period/sum for each individual in the population of the length of time at risk of getting the disease
41. A public health officer asks a pediatric cardiologist to assess the CBA of an intervention. CBA is best defined as which of the following?
A. An economic assessment method in which the costs and consequences of alternative interventions are expressed in costs per unit of health outcome
B. A methodology that is applicable to health programs as well as health services to help determine the preferred action that requires the least cost to produce a given level of effectiveness
C. An economic tool which uses quality of life measurements expressed as utilities (such as quality adjusted-life year or QALY) in the value equation
D. An economic assessment methodology that seeks to translate all relevant healthcare considerations into monetary terms by analyzing economic and social costs of medical care and benefits of reduced loss of net earnings due to preventing premature death or disability
E. None of the above
42. A review article on most current management of heart failure discussed a myriad of medical therapies for treatment of heart failure in children. The use of a particular β-blocker is discussed and “level C” is included at the end of the discussion. This designation is interpreted as which of the following?
A. At least fair scientific evidence that risks outweigh the benefit
B. Scientific evidence is lacking, or poor quality, or conflicting
C. At least fair scientific evidence (benefit and risk too close)
D. Good scientific evidence (benefits substantially outweigh risk)
E. At least fair scientific evidence (benefits outweigh the risk)
43. An athlete in a high school football game recently collapsed and died from a previously undiagnosed hypertrophic cardiomyopathy. A screening program for hypertrophic cardiomyopathy in a local high school with ECGs and echocardiograms for all student athletes yielded the data in Table 13.3.
Table 13.3 Hypertrophic Cardiomyopathy and ECG
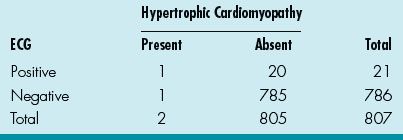
What is the sensitivity for the ECG?
A. 1/805
B. 1/21
C. 1/2
D. 1/786
E. 1/807
44. What is the specificity for the ECG? (Table 13.3)
A. 20/805
B. 785/805
C. 785/786
D. 20/807
E. 785/807
45. What is the PPV for the ECG? (Table 13.3)
A. 1/21
B. 1/805
C. 1/2
D. 20/805
E. 21/807
46. What is the NPV for the ECG? (Table 13.3)
A. 785/786
B. 1/786
C. 785/805
D. 1/805
E. 1/2
47. And finally, what is the LR? (Table 13.3)
A. (785/805)/[1–(1/2)]
B. (1/2)/[1–(785/805)]
C. (785/786)/[1–(1/2)]
D. (1/21)/[1–(785/805)]
E. (1/2)/[1–(785/786)]
48. The efficacy and safety of an angiotensin receptor blocker in Duchenne muscular dystrophy patients with severe heart failure is being studied in a multi-institutional study. In the treated groups, 5 of 200 had hospital admission for exacerbations of heart failure while 25 of the 250 untreated groups had exacerbations requiring hospitalization. What is the risk ratio?
A. 2.5/10
B. 5/200
C. 5/250
D. 25/200
E. 25/450
49. What is the RRR for the treated group?
A. 25%
B. 75%
C. 50%
D. 7.5%
E. None of the above
50. What is the NNT in this study for the treatment group?
A. 13.3
B. 7.5
C. 4
D. 2
E. Cannot calculate based on the available data
Answers
1. ANSWER: D. Data from variables can be categorical (qualitative) or numerical (quantitative).
Categorical data include (1) nominal data that describe data that can be in categories but have no particular order or magnitude differences (such as blood groups) and (2) ordinal data that are data that can be allocated to an ordered set of categories (such as AHA classes I to IV or severity of AV valve regurgitation from mild to severe).
Numerical data include (1) discrete data that can only be certain whole numbers (such as number of surgeries or catheterizations) and (2) continuous data that can be any numerical value (such as cardiac indices or pulmonary vascular resistances). Pulmonary vascular resistance, therefore, would be numerical data of a continuous nature.
2. ANSWER: A.
Case–control studies:
Advantages:
1. Permit the study of rare diseases.
2. Permit the study of diseases with long latency between exposure and manifestation.
3. Can be launched and conducted over relatively short time periods.
4. Relatively inexpensive as compared to cohort studies.
5. Can study multiple potential causes of disease.
Disadvantages:
1. Information on exposure and past history is primarily based on interview and may be subject to recall bias.
2. Validation of information on exposure is difficult, or incomplete, or even impossible.
3. By definition, concerned with one disease only.
4. Cannot usually provide information on incidence rates of disease.
5. Generally incomplete control of extraneous variables.
6. Choice of appropriate control group may be difficult.
7. Methodology may be hard to comprehend for nonepidemiologists and correct interpretation of results may be difficult.
Cohort studies:
Advantages:
1. Allow complete information on the subject’s exposure, including quality control of data, and experience thereafter.
2. Provide a clear temporal sequence of exposure and disease.
3. Give an opportunity to study multiple outcomes related to a specific exposure.
4. Permit calculation of incidence rates (absolute risk) as well as relative risk.
5. Methodology and results are easily understood by nonepidemiologists.
6. Enable the study of relatively rare exposures.
Disadvantages:
1. Not suited for the study of rare diseases because a large number of subjects are required.
2. Not suited when the time between exposure and disease manifestation is very long, although this can be overcome in historical cohort studies.
3. Exposure patterns, for example, the composition of oral contraceptives, may change during the course of the study and make the results irrelevant.
4. Maintaining high rates of follow-up can be difficult.
5. Expensive to carry out because a large number of subjects are usually required.
6. Baseline data may be sparse because the large number of subjects does not allow for long interviews.
(From Metric O. Cohort and Case–Control Studies, WHO)
3. ANSWER: B. A clinical trial is research involving administration of a test regimen to humans to evaluate both efficacy and safety. The several phases of a clinical trial are: (1) phase I—safety and pharmacologic profiles; (2) phase II—pilot efficacy studies; (3) phase III—extensive clinical trial; and (4) phase IV—studies after FDA approval for distribution.
Phase 0—administration of a single subtherapeutic doses of the drug to a small group (10 to 15 subjects) to gather preliminary data on pharmacokinetics and pharmacodynamics; phase I—a small group (20 to 80 subjects) of volunteers to assess the safety and pharmacokinetic profile of the medication; phase II—a large group (20 to 300 of subjects) to assess safety in a larger group of patients as well as effectiveness of the drug; phase III—randomized controlled multicenter trial on a relatively large group (300 to 3, 000 or more subjects) depending on the medical condition and is to assess the effectiveness of the drug in comparison with an accepted therapy; and phase IV—involves safety surveillance and ongoing technical support of a drug after permission for it to be distributed.
4. ANSWER: B. The Fisher’s exact test is used when the numbers in the contingency table of categorical variables are relatively small while the McNemar’s test is used for two groups with paired data. The Mantel–Haenszel test is an extension of the χ2 test used when comparing several two-way tables (such as for meta-analysis studies). Chi-squared (χ2) test is a measure of the difference between actual and expected frequencies with categorical variables.
5. ANSWER: E. Parametric tests are used to compare samples of normally (or Gaussian) distributed data. These tests include (1) the Student’s t-test (used to compare two samples to test the probability that the samples come from a population with the same mean value) and (2) the ANOVA (used to compare the means of two or more samples to see whether they are derived from the same population). The analysis of covariance (ANCOVA) is an extension of ANOVA to accommodate continuous variables. Note. The Kolmogorov–Smirnov test is used to test the hypothesis that the collected data are from a normal distribution so that the parametric statistics can be used.
Nonparametric tests are used when the data are not normally distributed so that the above tests are not appropriate. These tests include (1) the Wilcoxon signed-rank test (for comparing the difference between paired groups, as in t-test for parametric data); (2) the Mann–Whitney U test or the Wilcoxon ranks sum test (for comparing two sets of data that are derived from two different sets of subjects); and (3) the Kruskal–Wallis test (for comparing two or more independent groups, as in ANOVA for parametric data).
6. ANSWER: E. Incidence describes the frequency of occurrence of new cases during a time period, whereas prevalence describes what proportion of the population has the disease at a specific point in time. The prevalence P depends on both the incidence I and duration D of the disease (P = I × D).
Incidence is useful to explore causal theories or to evaluate effects of preventive measures, whereas prevalence is relevant to planning of health services or assessing need for medical care in a population. Lastly, while chronic diseases can have lower incidence than prevalence, acute illnesses can be the opposite.
Incidence:
Incidence (I) (also incidence rate or incidence density) (person-time units):
whereas
Cumulative incidence (CI) (also cumulative incidence rate or incidence proportion) (0–1 or %):
Prevalence:
Prevalence (P) (also prevalence rate, point prevalence rate, or prevalence proportion) (0–1 or %):

7. ANSWER: A. Correlation is often confused with “regression, ” which quantifies the association between two variables. Regression analysis is used to delineate how one set of data relates to another through a best fit line, in which the regression coefficient is the slope of the line. While this describes a simple linear regression, other types of regression include (1) logistic regression (variation of linear regression when there are only two possible outcomes); (2) Poisson regression (variation of regression calculations to allow for frequency of rare events); and (3) Cox proportional hazards regression model (used in survival analysis to investigate the relationship between an event and several variables).
The most common survival curve method is the Kaplan–Meier curve, which graphically displays the survival of a cohort with calculation of survival estimates upon each death or event (as seen in Figure 13.1). A nonparametric test to compare the survival between two potential Kaplan–Meier curves is the log rank test.
8. ANSWER: A. The sensitivity and specificity of a diagnostic test depends on more than just the “quality” of the test; they also depend on the definition of what constitutes an abnormal test. Look at the idealized graph above showing the number of patients with and without a disease arranged according to the value of a diagnostic test. This distributions overlap; the test (like most) does not distinguish normal from disease with 100% accuracy. The area of overlap indicates where the test cannot distinguish normal from disease.
In practice, we choose a cutoff (indicated by the vertical black line) above which we consider the test to be abnormal and below which we consider the test to be normal. The position of the cutpoint will determine the number of true positive, true negatives, false positives, and false negatives. We may wish to use different cutoffs for different clinical situations if we wish to minimize one of the erroneous types of test results.
9. ANSWER: A. A normal or Gaussian distribution is a well recognized curve (see Figure 13.4). This reflects a continuous probability distribution that is bell-shaped (unimodal) and symmetrical about the mean with two parameters, the mean (μ) and the variance (σ2). The SD is the measure of dispersion or variability in a sample. The SD is used for data that are normally distributed (±1SD = 68.2%, ±2SD = 95.4%, and ±3SD = 99.7% of data). The mean and the median of a normal distribution are equal.
Note: A quick check to see whether a distribution is normally distributed is to see whether two SD away from the mean are still within the possible range for the variable. {COMP: Please insert Figure 13.4. here}
The t-distribution is similar to the normal distribution but more spread out with longer tails.
Examples of continuous probability distributions that are not normal include the χ2-distribution (a right skewed distribution characterized by degrees of freedom); the F-distribution (also skewed to the right and used for comparing two variances); and the lognormal distribution (highly skewed to the right as it is the probability distribution of a random variable whose log follows the normal distribution. The binomial and Poisson distributions are types of discrete probability distributions.
10. ANSWER: C. CI is the range that is likely to contain the true population mean value that would be present (if the data for the whole population is obtained). A 95% CI means that there is 95% chance that the population value lies within the stated limits. The SD indicates the variability in a sample. In a normal distribution, 95% of the distribution of the sample means is within 1.96 SD of the population mean. The SD is the SEM and the 95% CI for the mean is calculated by:
Sample mean – 1.96 × SEM to sample mean + 1.96 × SEM
The size of the CI would be related to the sample size of the study (the larger the study population the narrower the CI).
11. ANSWER: C. There are two types of applied statistics. Descriptive statistics (means, medians, modes, SD, quartiles, and histograms) describe the data in a sample. Inferential statistics are statistical methods that estimate whether results suggest a real difference between populations (such as the Student’s t-test, ANOVA, and the chi-squared test).
12. ANSWER: E. A type I error (α error) occurs when a null hypothesis that is correct is rejected (declaring that there is a difference when there is not). A type II error (β error) occurs when a hypothesis that is incorrect is accepted (declaring that a difference does not exist when in fact it does). The chance of making a type I error is the same as the P value. Note: A type III error is a study design that produces the right answer to the wrong question.
The P (probability) value is the probability that defines how likely it is that a hypothesis (usually the null hypothesis) is true (that there is no difference between two treatments). The P value is therefore the probability of an observed difference occurring solely by chance. The usual P value at the significance level is 0.01 to 0.05. Note: A method used to adjust the P value for multiple testing is the Bonferroni adjustment.
13. ANSWER: B. The power of a study is the probability that it would detect a statistically significant difference. As the β value is the probability of accepting a hypothesis that is false, the power of the study (1 – β) is therefore the probability of rejecting the null hypothesis when it is false. The power of a study should be at least 80% and is increased by several factors including larger significance level, larger effects, decreased variability of the observations, and larger sample size.
14. ANSWER: A. A CEA is an economic assessment method in which the costs and consequences of alternative interventions are expressed in costs per unit of health outcome. This commonly used methodology is applicable to health programs as well as health services to help determine the preferred action that requires the least cost to produce a given level of effectiveness.
Another economic tool is the CUA, which uses quality-of-life measurements expressed as utilities (such as QALY) in the value equation. A disability-adjusted life year (DALY) is also a measure used but is for the overall “burden of disease.” It quantifies the impact of not only premature death as in QALY but also disability on a population by combining them into a single, comparable metric.
A third economic assessment methodology is the CBA, which seeks to translate all relevant healthcare considerations into monetary terms by analyzing economic and social costs of medical care and benefits of reduced loss of net earnings due to preventing premature death or disability.
Other less common methods of economic evaluation include cost-consequence analysis (CCA), CMA, and even CVA.
15. ANSWER: C. A meta-analysis is a technique in which results from a number of studies that are similar in nature are gathered to give one overall estimate of the effect. The formal steps include (1) decide on effect of interest, (2) check for statistical homogeneity, (3) estimate the average effect of interest with CIs, and (4) interpret the results and present the findings (forest plot). The advantages include refinement and reduction, efficiency, generalizability and consistency, reliability, and power and precision. The disadvantage include publication bias, clinical heterogeneity, quality differences, and lack of independence of study subjects.
A systemic review (such as the international network called the Cochrane collaboration with its Cochrane database of systematic reviews) often uses meta-analysis techniques to render well-informed clinical decisions; it is an essential part of evidence-based medicine. Major disease categories will often have sufficient number of randomized clinical trials for at the minimum a meta-analysis to determine the value of such an intervention.
16–18. ANSWERS: 16) C; 17) B; and 18) A. Risk ratio (also relative risk), used in prospective cohort studies, is calculated by dividing the risk in the treated or exposed group by the risk in the control or unexposed group (as in odds ratio, risk ratio can be <1, 1, or >1 and given with their 95% CI—if the CI includes 1, it is not statistically significant). In this case, the risk ratio is: 3.4/4.9 = 0.69.
The RRR is the proportion by which the intervention reduces the event rate while the absolute risk reduction (ARR) is the difference between the event rates in the intervention versus control groups. The RRR in this study is 4.9 – 3.4 / 4.9 = 31%.
The NNT is the number of patients who need to be treated for one to get benefit and is the reciprocal of ARR (ARR = 100 / NNT). The ARR in this case 4.9 – 3.4 = 1.5%, so the NNT = 100 / ARR = 100 / 1.5 = 67.
Odds ratio, used in retrospective case–control studies, is calculated by comparing odds (calculated by dividing the event occurrence by the number of times that the event does not happen) of the exposed versus control groups (odds ratio can be <1, 1, or >1 and given with their 95% CI—if the CI includes 1, it is not statistically significant).
19. ANSWER: A. The ROC curve is a two-way plot of the sensitivity (true-positive rate) against one minus the specificity (false-positive rate) for different cutoff values for a continuous variable in a diagnostic test (see excellent website with moving description of all the above at www.anaesthetist.com/mnm/stats/roc/Findex.htm). The upper left corner or coordinate (0, 1) is called the perfect classification (100% sensitivity or no false negatives and 100% specificity or no false positives) (Figure 13.5).
20. ANSWER: E. The variance is the square of the SD while coefficient of variation is the ratio of the SD to the mean. While the SD is a measure of spread away from the mean and is equal to the square root of the variance, the SEM is a measure of precision of the sample mean or how close the sample mean is likely to be to the population mean.
21. ANSWER: B. Accuracy is the degree of closeness of measurements to that quantity’s true value while precision is the reproducibility of a study result with the study to be repeated under the same circumstances (measured by standard error of measurement) (Figure 13.6).
22. ANSWER: A. Chi-squared (χ2) test is a measure of the difference between actual and expected frequencies with categorical variables; a contingency table is set up to calculate the χ2 value. If there is no difference between actual and expected frequencies, than χ2 would be 0. The larger the difference, the bigger the χ2 value (but it is easier to note the P value that accompanies the χ2 value). The df is the number of independent comparisons that can be made between members of the sample and is used with χ2 value to calculate the P value. In this case, the df (of 1) is needed to calculate the P value. The χ2 test is sometimes used with Yates continuity correction to improve the accuracy of the P value.
The Fisher’s exact test is used when the numbers in the contingency table of categorical variables are relatively small while the McNemar’s test is used for two groups with paired data. The Mantel–Haenszel test is an extension of the χ2 test used when comparing several two-way tables (such as for meta-analysis studies).
23. ANSWER: A. Correlation coefficient is the strength of the linear relationship between two variables, and this relationship is denoted by the letter r that ranges from −1 to +1 (R2 is sometimes given to correct for negatively correlated relationships). The coefficient r cannot be calculated when there is neither a nonlinear relationship nor when there are outliers.
When the degree of linear relationship is extended to several variables, it is known as multiple correlation coefficient. The Pearson correlation coefficient “r” is used if the values are sampled from a normally distributed populations (if not, the Spearman correlation coefficient “rs” is used).
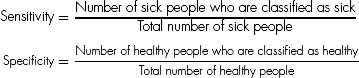
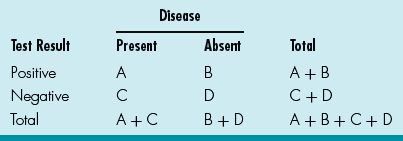
24, 25. ANSWERS: 24) A; and 25) C. Sensitivity is the probability that a diseased individual is correctly classified as sick, and specificity is the probability that a healthy individual is correctly classified as healthy. There is interdependence between sensitivity and specificity (see Figure 13.5).
Also, sensitivity/specificity and predictive values (positive and negative) relate to each other by the two-way (Table 13.4):
Table 13.4 Disease and Test Result
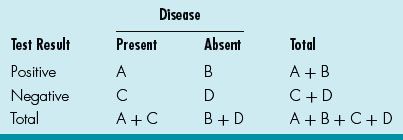
Sensitivity: A / A + C (how often the test is positive if the patient has the disease)
Specificity: D / D + B (how often the test is negative if the patient is healthy)
PPV: A / A + B (likelihood that patient has disease if test is positive)
NPV: D / D + C (likelihood that patient is healthy if test is negative)
The higher the calculated value, the more valuable the test as the perfect test will have a calculated value of 1.
An LR is the likelihood that a test result would be expected in a patient with the condition compared to the likelihood that the same result would be in a patient without the condition. To calculate this: LR = Sensitivity / (1 – Specificity).
For this case, the PPV is A / A + B or 50 / 55.
The LR is (A / A + C) / [1 – (D / D + B)] = (50 / 75) / [1– (100 / 105)]. The latter implies that if the test is positive in a patient, that patient is many more times likely to have the disease than not have it.
26. ANSWER: C. An RCT is a trial in which the patients are randomized to receive either the new or a control treatment. An ideal randomization involves equal group sizes, low selection bias, and low probability of confounding (accidental bias). Refinements of simple randomization include stratified randomization (controls for effects of factors), blocked randomization (assures treatment groups to be equal-sized), and cluster randomization (allocates groups of patients). In addition, there is response-adaptive randomization (also termed outcome-adaptive randomization) in which the probability of being assigned to a group increases if the responses of the prior patients is deemed favorable. Allocation bias and confounding are avoided as much as possible to maximize efficiency of the study. A placebo-controlled study involves a control group that does not receive the treatment.
27. ANSWER: B. Bias occurs when there is a systematic difference between the results of a study and the true results. The types of bias include observer bias (observer inaccurately assesses variable), confounding bias (spurious association), selection bias (selected study subjects not representative), information bias (measurements incorrectly recorded), publication bias (only positive results are published), and others (recall, assessment, and allocation bias).
28. ANSWER: E. An association is any relationship between two measured quantities that relates them to be statistically dependent, whereas correlation defines a linear relationship between the two quantities. Causation in addition to association includes the following criteria: temporality, strength of causality, dose–response, repetition in a different population, consistency with other studies, and biologic plausibility.
29. ANSWER: A. The Belmont report elucidates three principles of research ethics: (1) respect for persons: protecting the autonomy of all people and treating them with courtesy and respect and allowing for informed consent. Researchers must be truthful and conduct no deception; (2) beneficence: the philosophy of “do no harm” while maximizing benefits for the research project and minimizing risks for the research subjects; and 3) justice: ensuring reasonable, nonexploitative, and well-considered procedures are administered fairly and equally.
30. ANSWER: C. The Internal Review Board (IRB), also known as the ethical review board, is a committee that is designated to approve and review research involving human subjects to protect the rights and welfare of human research subjects. The DSMB is an independent group of experts that continuously monitors the data from various aspects of a clinical trial to ensure patient safety as well as validity and scientific merit of the trial. The difference between the IRB and the DSMB is that the IRB is primarily responsible for the review of clinical protocols and related documents while the DSMB’s main responsibility is to review the trial safety and efficacy data.
31. ANSWER: C. Validity is the extent to which the study measures what it is intended to measure so that validity is a measurement of systematic error or bias (examples are confounding and selection bias). Reliability is the consistency of a set of measurements or a measurement tool, or the repeatability and reproducibility of such a methodology (inversely related to random error).
Accuracy is the degree of closeness of measurements to that quantity’s true value while precision is the reproducibility of a study result with the study to be repeated under the same circumstances (measured by standard error of measurement).
32. ANSWER: A. Sample size calculation involves the following parameters: power (usually 0.80); significance level (usually 0.01or 0.05); variability of the observations (or the SD); and the smallest effect of interest (the standardized difference).
33. ANSWER: E.
Case–control studies:
Advantages:
1. Permit the study of rare diseases.
2. Permit the study of diseases with long latency between exposure and manifestation.
3. Can be launched and conducted over relatively short time periods.
4. Relatively inexpensive as compared to cohort studies.
5. Can study multiple potential causes of disease.
Disadvantages:
1. Information on exposure and past history is primarily based on interview and may be subject to recall bias.
1. Validation of information on exposure is difficult, or incomplete, or even impossible.
2. By definition, concerned with one disease only.
3. Cannot usually provide information on incidence rates of disease.
4. Generally incomplete control of extraneous variables.
5. Choice of appropriate control group may be difficult.
6. Methodology may be hard to comprehend for nonepidemiologists, and correct interpretation of results may be difficult.
Cohort studies:
Advantages:
1. Allow complete information on the subject’s exposure, including quality control of data, and experience thereafter.
2. Provide a clear temporal sequence of exposure and disease.
3. Give an opportunity to study multiple outcomes related to a specific exposure.
4. Permit calculation of incidence rates (absolute risk) as well as relative risk.
5. Methodology and results are easily understood by nonepidemiologists.
6. Enable the study of relatively rare exposures.
Disadvantages:
1. Not suited for the study of rare diseases because a large number of subjects are required.
2. Not suited when the time between exposure and disease manifestation is very long, although this can be overcome in historical cohort studies.
3. Exposure patterns, for example, the composition of oral contraceptives, may change during the course of the study and make the results irrelevant.
4. Maintaining high rates of follow-up can be difficult.
5. Expensive to carry out because a large number of subjects are usually required.
6. Baseline data may be sparse because the large number of subjects does not allow for long interviews.
(From Metric O. Cohort and Case–Control Studies, WHO)
34. ANSWER: A. Nonparametric tests are used when the data are not normally distributed. These tests include (1) the Wilcoxon signed-rank test (for comparing the difference between paired groups, as in t-test for parametric data); (2) the Mann–Whitney U test or the Wilcoxon ranks sum test (for comparing two sets of data that are derived from two different sets of subjects); and (3) the Kruskal–Wallis test (for comparing two or more independent groups, as in ANOVA for parametric data).
35. ANSWER: B. See Table 13.5.
Table 13.5 Summary of Statistical Methods
36. ANSWER: A. Categorical data include (1) nominal data that describe data that can be in categories but have no particular order or magnitude differences (such as single ventricle and biventricular surgical strategies or antiarrhythmic agent for supraventricular tachycardia) and (2) ordinal data that are data that can be allocated to an ordered set of categories (such as severity of AV valve regurgitation from mild to severe).
Numerical data include (1) discrete data that can only be certain whole numbers (such as number of reinterventions after Norwood procedure) and (2) continuous data that can be any numerical value (such as blood pressure measurements before and after ACE inhibitors).
37. ANSWER: B. A case–control study is a retrospective study that studies the relationship between risk factor and outcome and uses relevant exposure or condition information from a sample of individuals with the disease or condition (cases) rather than examining the entire population.
A case series refers to the qualitative study of a single patient or small group of patients with a similar disease.
A cohort study (also termed follow-up, longitudinal, or prospective study) is a prospective observational study with study subjects (cohort) assigned to an exposure or condition category and then all followed for a defined observation period to see whether they develop disease. A historical cohort study, as the name implies, is a group of patients from the past and would not involve active enrollment of new study subjects.
38. ANSWER: C. This study fits phase III criteria. Phase 0—administration of a single subtherapeutic doses of the drug to a small group (10 to 15 subjects) to gather preliminary data on pharmacokinetics and pharmacodynamics; phase I—a small group (20 to 80 subjects) of volunteers to assess the safety and pharmacokinetic profile of the medication; phase II—a large group (20 to 300 of subjects) to assess safety in a larger group of patients as well as effectiveness of the drug; phase III—randomized controlled multicenter trial on a relatively large group (300 to 3, 000 or more subjects) depending on the medical condition and is to assess the effectiveness of the drug in comparison with an accepted therapy; and phase IV—involves safety surveillance and ongoing technical support of a drug after permission for it to be distributed.
39. ANSWER: E. The Fisher’s exact test is used when the numbers in the contingency table of categorical variables are relatively small while the χ2 test is a measure of the difference between actual and expected frequencies with categorical variables with larger (>5) populations. Both are tests used for categorical data. The other tests are all used for numerical data.
Parametric tests are used to compare samples of normally (or Gaussian) distributed data. These tests include (1) the Student’s t-test (used to compare two samples to test the probability that the samples come from a population with the same mean value) and (2) the ANOVA (used to compare the means of two or more samples to see whether they are derived from the same population). The Kolmogorov–Smirnov test is used to test the hypothesis that the collected data are from a normal distribution, so that the parametric statistics can be used. Nonparametric tests are used when the data are not normally distributed, so that the above tests are not appropriate. These tests include the Wilcoxon signed-rank test (for comparing the difference between paired groups, as in t-test for parametric data).
40. ANSWER: C. Incidence describes the frequency of occurrence of new cases during a time period, whereas prevalence describes what proportion of the population has the disease at a specific point in time. The prevalence P depends on both the incidence I and duration D of the disease (P = I × D) (see explanation under question 6).
Prevalence (P) (also prevalence rate, point prevalence rate, or prevalence proportion) (0–1 or %):

41. ANSWER: D. A CEA is an economic assessment method in which the costs and consequences of alternative interventions are expressed in costs per unit of health outcome. Another economic tool is the CUA, which uses quality of life measurements expressed as utilities (such as QALY) in the value equation. A third economic assessment methodology is the CBA, which seeks to translate all relevant healthcare considerations into monetary terms by analyzing economic and social costs of medical care and benefits of reduced loss of net earnings due to preventing premature death or disability (see answer 14).
42. ANSWER: C. A designation from level A to I as described by the U.S. Preventive Services Task Force can be made for each review: (1) level A—good scientific evidence (benefits substantially outweigh risk); (2) level B—at least fair scientific evidence (benefits outweigh the risk); (3) level C—at least fair scientific evidence (benefit and risk too close); (4) level D—at least fair scientific evidence that risks outweigh the benefit; and (5) level I—scientific evidence is lacking, or poor quality, or conflicting.
43–47. ANSWERS: 43) C; 44) B; 45) A; 46) A; and 47) B. See Table 13.6.
Table 13.6 Disease and Test Result
Sensitivity: A / A + C (how often the test is positive if the patient has the disease)
Specificity: D / D + B (how often the test is negative if the patient is healthy)
PPV: A / A + B (likelihood that patient has disease if test is positive)
NPV: D / D + C (likelihood that patient is healthy if test is negative)
An LR is the likelihood that a test result would be expected in a patient with the condition compared to the likelihood that the same result would be in a patient without the condition. To calculate this: LR = sensitivity / (1 – specificity).
The higher the calculated value, the more valuable the test as the perfect test will have a calculated value of 1. The ECG as a screening tool in this case had a relatively low sensitivity and PPVs (hence one of the criticisms of ECG as a screening tool) but acceptable NPV.
48–50. ANSWERS: 48) A; 49) B; and 50) A. Risk ratio (also relative risk), used in prospective cohort studies, is calculated by dividing the risk in the treated or exposed group by the risk in the control or unexposed group (as in odds ratio, risk ratio can be <1, 1, or >1 and given with their 95% CI—if the CI includes 1, it is not statistically significant). In this case, the risk ratio is: 2.5/10 = 0.25 or 25%.
The RRR is the proportion by which the intervention reduces the event rate while the ARR is the difference between the event rates in the intervention versus control groups. The RRR in this study is 10 – 2.5 / 10 = 0.75 or 75%.
The NNT is the number of patients who need to be treated for one to get benefit and is the reciprocal of ARR (NNT = 100 / AAR). The ARR in this case is 10 – 2.5 = 7.5%, so the NNT = 100 / ARR = 100 / 7.5 = 13.3.
Suggested Reading
Ahlbom A, Norell S. Introduction to Modern Epidemiology. Chestnut Hill, MA: Epidemiology Resources Inc.; 1990.
Harris M, Taylor G. Medical Statistics Made Easy. London: Taylor and Francis; 2004.
Last JM. A Dictionary of Epidemiology. Oxford: Oxford University Press; 2001.
Petrie A, Sabin C. Medical Statistics at a Glance. Oxford: Blackwell Publishing; 2005.
Stay updated, free articles. Join our Telegram channel

Full access? Get Clinical Tree


