The aim of this study was to determine the prevalence of hypertension in overweight or obese pediatric subjects using different national or international references, which are based either on the entire population or on normal weight children only: 188 centers from Germany, Austria, and Switzerland participated in the Adipositas Patienten Verlaufsbeobachtung initiative. Data from 57,915 children aged 6 to 18 years who are overweight or obese were used to determine the prevalence of prehypertension and hypertension based on Second Task Force, European pooled data, Fourth Report all and Fourth Report nonoverweight, or German Health Interview and Examination Survey for Children and Adolescents (KiGGS) references. Three references included overweight children, whereas 2 (Fourth Report nonoverweight and KiGGS) were based on nonoverweight children only. Based on KiGGS, Fourth Report nonoverweight, Fourth Report all, European pooled data, or Second Task Force, the prevalence of hypertension was 47%, 42%, 36%, 32%, and 27%, respectively. Recent references classified more children as hypertensive, whereas fewer children fell into the prehypertensive group. Only 22% of children were classified as hypertensive by each of the 5 references (8% as prehypertensive). The prevalence of normal blood pressure was independent of the reference applied. Hypertension as defined by the different reference systems was significantly correlated, and all methods were significantly associated with impaired glucose metabolism or dyslipidemia, without significant differences in methods. In conclusion, the diagnosis of elevated blood pressure depends on the reference population used. A nonoverweight reference population substantially increases the prevalence of hypertension in children and adolescents who are overweight or obese. The choice of the reference has significant implications for risk stratification and treatment decisions.
Pediatric obesity is associated with elevated blood pressure (BP), impaired glucose tolerance, and dyslipidemia, which are risk factors for cardiovascular disease and type 2 diabetes mellitus.
The aim of our study was to use different national and international references for the determination of the prevalence of increased BP in a large number of children and adolescents who are overweight or obese from German, Austrian, and Swiss pediatric treatment facilities. References were the contemporary nonoverweight reference population from the same country (Germany, German Health Interview and Examination Survey for Children and Adolescents [KiGGS]) or the Fourth Report database restricted to nonoverweight children (Fourth Report nonoverweight). These results were compared with current Fourth Report recommendations (identical to recommendations by European Society for Hypertension (ESH)/European Society of Cardiology), with the previous ESH/European Society of Cardiology guidelines, and with the definition of hypertension by the Second Task Force. These last 3 reference populations included children who are overweight/obese. Furthermore, the association of hypertension with impaired glucose and lipid metabolism was compared based on all 5 references.
Methods
The “Adipositas Patienten Verlaufsbeobachtung” (APV, obese patients observational study) is a standardized multicenter database of children and adolescents who are overweight or obese ( www.a-p-v.de ). A total of 188 specialized obesity care centers (161 outpatient programs and 27 inpatient rehabilitation institutions) in Germany, Austria, and Switzerland participated in the study from January 2000 to October 2012. The data were anonymized and transmitted for central analysis to the University of Ulm, Germany. Every 6 months, inconsistent data were reported back to the centers for correction. Data collection was co-ordinated with all local data protection committees. Approval for data analysis was obtained from the Ethics Committee by the Institutional Review Board of Ulm University.
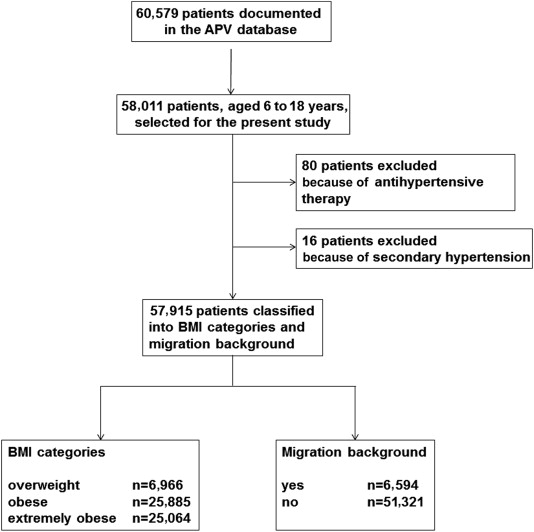
By October 2012, weight, height, and BP from 60,579 subjects were documented. For the present study, all 58,011 patients of the APV population between 6 and 18 years were selected. Of these, 80 patients were on antihypertensive medication. In addition, 16 subjects had secondary hypertension because of renal (n = 5), endocrine (n = 8), or cardiovascular (n = 3) causes. Therefore, 57,915 subjects were included in the analysis. Patients’ mean age was 12.7 years (±2.5), mean height was 158.9 cm (±13.2), mean weight was 78.9 kg (±23.3), body mass index (BMI) 30.5 kg/m 2 (±5.6), and BMI-Standard Deviation Score (BMI-SDS) 2.5 (±0.5). Nonoverweight was defined as a BMI <90th percentile; overweight as a BMI ≥90th but <97th percentile; obesity as a BMI ≥97th but <99.5th percentile; and extreme obesity as a BMI ≥99.5th percentile, the latter corresponding to a BMI >40 kg/m 2 in adults. More children were obese (n = 25,885, 45%) or extremely obese (n = 25,064, 43%) than overweight (n = 6,966, 12%). Slightly more girls (54%) participated in the study. Most study participants came from Germany (n = 56,420).
Migration background was defined as being born abroad or having a mother and/or father whose country of birth lies outside Germany, Austria, or Switzerland. The number of patients with migration background was 6,594 (11%), with a mean age of 12.5 years (±2.6), a mean height of 157.4 cm (±13.5), a mean weight of 79.2 kg (±24.2), BMI 31.2 kg/m 2 (±5.8), and BMI-SDS 2.6 (±0.5); 50% of children with migration background were extremely obese (41% were obese and 9% were overweight). In Germany, the largest migrant group comes from Turkey, followed by Poland. A flow chart of patient selection is given in Figure 1 .
Body height was measured in accordance with the German working group on obesity in children and adolescents. BP was measured according to the guidelines of the German Hypertension League ( www.paritaet.org/RR-Liga ). BP levels were measured after 3 to 5 minutes of rest, the patient in a seated position, at the upper arm, with proper cuff size, and the cuff placed at heart level using sphygmomanometer or oscillometric measurement devices; 53% of patients were seen at centers, where mainly auscultatoric measurement was used; 47% of patients were cared for at centers, where predominantly oscillometric measurement was applied. BP measuring devices used at the centers were validated according to standard protocols and conformed to the European standard specifications of having a leak rate within 4 mm Hg/min and a pressure scale accurate to within ±3 mm Hg. BP measurements with oscillometric devices or mercury sphygmomanometer may differ slightly. According to the literature, oscillometric methods may overestimate or underestimate systolic and diastolic BP values. Therefore, no correction factor was used.
The guidelines define hypertension as BP levels ≥95th percentile at 3 measurements on 2 different days. Statistical analysis was based on median BP documented during the first 6 weeks after initial presentation of the patient. BP values were classified as normal (<90th percentile), prehypertension (≥90th to <95th percentile, ≥120/80 mm Hg even if <90th percentile in adolescents), or hypertension (≥95th percentile).
BP was classified based on Second Task Force, ESH European pooled data, ESH Fourth Report all children (Fourth Report all), Fourth Report nonoverweight children (Fourth Report nonoverweight), and recent KiGGS. To allow comparison among all 5 references, subjects were restricted to the age range of 6.0 to 18.0 years.
BMI- and height-SDS were calculated according to current German reference data (KiGGS), and patients were divided into 3 groups: <25th, 25th to 75th, and ≥75th percentile. To consider the influence of height on hypertension prevalence, the study population was again divided into 3 groups: <25th, 25th to <75th, and ≥75 th percentile.
Impaired glucose metabolism was defined as a fasting glucose level of >110 mg/dl (>5.6 mmol/L) or a glucose concentration of >140 mg/dl (>7.8 mmol/L) 2 hours after an oral glucose tolerance test (21). Dyslipidemia was defined as total cholesterol >200 mg/dl (>5.1 mmol/L), low-density lipoprotein (LDL) cholesterol >130 mg/dl (>3.4 mmol/L), high-density lipoprotein (HDL) cholesterol <35 mg/dl (<0.9 mmol/L), or triglycerides >150 mg/dl (>1.7 mmol/L).
SAS, version 9.4 (SAS Institute, Cary, North Carolina), was used for statistical analysis. Clinical characteristics of the study population are given as mean (SD). Association of hypertension with impaired glucose or lipid metabolism was estimated by logistic regression adjusted for age, gender, and BMI category and given as odds ratios (95% confidence interval [CI]). A random factor with Cholesky covariance structure was used to model the variability in centers. Prevalence of hypertension was modeled using hierarchic logistic regression (SAS proc glimmix, estimation by restricted partial likelihood, denominator degrees of freedom according to Kenward-Roger, optimization of iterations by the Newton-Raphson method). Patient groups were compared by adjusted means based on observed marginal frequencies. Spearman correlation coefficients with 95% confidence intervals based on Fisher z-transformation were used to compare the classification of hypertension among the 5 different methods. A p value <0.05 was considered to be statistically significant.
Results
In Figure 2 , BP in children, aged 6 to 18 years, who were overweight/obese was evaluated according to Second Task Force published in 1987, ESH European pooled data (1991), ESH Fourth Report all (2004), ESH Fourth Report nonoverweight (2008), and KiGGS (2011). Major differences were observed in the classification of hypertension: Referred to a solely nonoverweight German reference population (KiGGS), the prevalence of hypertension was highest with 47.3%, followed by Fourth Report nonoverweight with 42.4%, Fourth Report all (36.3%), European pooled data (32.0%), and Second Task Force (27.2%). In correspondence to the increase in the prevalence of hypertension, the prevalence of prehypertension decreased. The percentage of normal BP was similar for all reference systems.
In addition, the proportion of children consistently categorized by every method was calculated: 7.9% for prehypertension, 21.8% for hypertension, and 29.4% for normotension. Therefore, in 40.9% of children classification differed. To agree with respect to classification as hypertensive was closest for Fourth Report all and Fourth Report nonoverweight (r = 0.870; 95% CI 0.868 to 0.872) and slightly lower for KiGGS versus Fourth Report all (r = 0.772; 95% CI 0.769 to 0.776) or Fourth Report nonoverweight (r = 0.796; 95% CI 0.793 to 0.799). Hypertension based on European pooled data agreed better with KIGGS (r = 0.707; 95% CI 0.702 to 0.713) compared with Fourth Report all (r = 0.659; 95% CI 0.655 to 0.644). However, hypertension based on Second Task Force agreed also best with Fourth Report all (r = 0.759; 95% CI 0.756 to 0.763), whereas it was lower with KiGGS (r = 0.637; 95% CI 0.633 to 0.642).
The percentage of subjects with hypertension in each weight status category increased from the older to the more recent references. An opposite effect was observed for prehypertension. Rates of hypertension related to weight status category are listed in Table 1 . A comparison of children who are overweight with those who are extremely obese revealed a greater percentage of hypertension in subjects who are extremely obese (p <0.001; Table 1 ). Furthermore, early pubertal children, aged 11 to <14 years, were hypertensive and more often compared with the other age groups (p <0.001; exception European pooled data; Table 1 ).
| Weight status category | Age (years) | |||||||
|---|---|---|---|---|---|---|---|---|
| overweight | obese | extremely obese | P | <11 | 11-<14 | 14-18 | P | |
| Second Task Force | 14.4 [13.6-15.2] | 22.1 [21.6-22.6] | 35.1 [34.5-35.7] | <0.001 | 27.4 [26.6-28.1] | 28.8 [28.3-29.4] | 21.7 [21.1-22.4] | <0.001 |
| European pooled data | 19.4 [18.5-20.3] | 26.8 [26.2-27.3] | 40.6 [40.0-41.2] | <0.001 | 34.3 [33.5-35.1] | 32.7 [33.2-33.4] | 27.4 [26.7-28.0] | <0.001 |
| 4th Report all | 22.1 [21.1-23.1] | 30.7 [30.2-31.3] | 46.0 [45.4-46.6] | <0.001 | 34.2 [33.9-35.0] | 37.2 [36.5-37.8] | 35.3 [34.5-36.0] | <0.001 |
| 4th Report non-overweight | 26.8 [25.8-27.9] | 36.9 [36.0-37.5] | 52.3 [51.7-52.9] | <0.001 | 42.0 [41.1-42.8] | 43.6 [43.0-44.2] | 40.1 [39.4-40.9] | <0.001 |
| KiGGS | 31.6 [30.5-32.7] | 42.1 [41.4-42.7] | 56.9 [56.2-57.5] | <0.001 | 47.8 [47.0-48.7] | 50.3 [49.7-51.0] | 42.3 [41.6-43.1] | <0.001 |
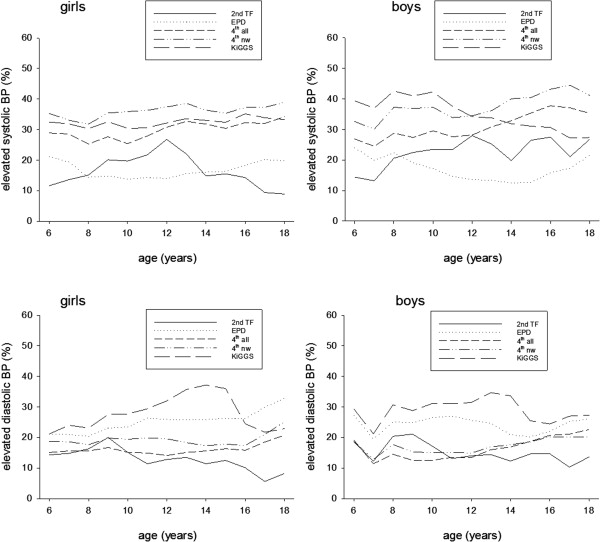
Shorter children had hypertension more often than taller ones (each reference p <0.001), except according to the Second Task Force and KiGGS ( Table 2 ). Significantly more boys than girls had hypertension (p <0.05 to p <0.001), except when European pooled data were the reference. More girls were hypertensive based on the European pooled data (p <0.05; Table 2 ). Prevalence of elevated systolic or diastolic BP in girls and boys in yearly age intervals is shown in Figure 3 . Different rates were observed depending on the reference, gender, and age of the child.
| Height | Sex | ||||||
|---|---|---|---|---|---|---|---|
| <25th percentile | 25th – <75th percentile | ≥75th percentile | P | male | female | P | |
| Second Task Force | 19.9 [18.9-20.8] | 24.4 [23.8-24.9] | 29.7 [29.1-30.2] | <0.001 | 29.5 [28.9-30.0] | 23.3 [22.8-23.8] | <0.001 |
| European pooled data | 41.0 [39.8-42.2] | 32.4 [31.8-33.0] | 28.0 [27.4-28.5] | <0.001 | 30.8 [30.2-31.3] | 31.8 [31.2-32.3] | < 0.05 |
| 4th Report all | 39.1 [38.0-40.3] | 36.7 [36.1-37.3] | 34.1 [33.5-34.7] | <0.001 | 36.9 [36.3-37.5] | 34.8 [34.3-35.4] | <0.001 |
| 4th Report non-overweight | 44.6 [43.4-45.8] | 42.1 [41.5-42.7] | 41.4 [40.7-42.0] | <0.001 | 42.6 [42.0-43.2] | 41.6 [41.0-42.2] | <0.05 |
| KiGGS | 46.9 [45.7-48.1] | 47.1 [46.4-47.7] | 47.2 [46.5-47.8] | ns | 48.1 [47.5-48.7] | 46.2 [45.7-46.8] | <0.001 |
Adjusted for age, gender, and BMI category, subjects with or without migration background showed similar prevalence rates of normal BP or hypertension according to each reference. However, the proportion of prehypertension was slightly lower in children with migration background based on Second Task Force (p <0.01) and Fourth Report all (p <0.05; Table 3 ).
| Pre-hypertension | P | Hypertension | P | |||
|---|---|---|---|---|---|---|
| migration | no migration | migration | no migration | |||
| Second Task Force | 34.7 [33.6-35.9] | 36.5 [36.1-36.9] | <0.01 | 26.4 [25.4-27.5] | 26.1 [25.8-26.6] | ns |
| European pooled data | 31.5 [30.3-32.6] | 32.3 [31.9-32.8] | ns | 31.0 [29.9-32.1] | 31.5 [31.1-31.9] | ns |
| 4 th Report all | 25.2 [24.2-26.3] | 26.5 [26.1-26.9] | <0.05 | 36.4 [35.3-37.6] | 35.7 [35.3-36.2] | ns |
| 4 th Report non-overweight | 21.5 [20.5-22.5] | 22.0 [21.6-22.4] | ns | 42.4 [41.2-43.6] | 42.0 [41.6-42.5] | ns |
| KiGGS | 17.7 [16.8-18.6] | 18.2 [17.9-18.6] | ns | 46.8 [45.5-48.0] | 47.1 [46.7-47.6] | ns |
Stay updated, free articles. Join our Telegram channel

Full access? Get Clinical Tree


