Assessment of the Tricuspid and Pulmonic Valves


Assessment of the Tricuspid and Pulmonic Valves


Rebecca A. Schroeder

Jonathan B. Mark

Katherine A. Grichnik


Evaluation of the right-sided cardiac valves with transesophageal echocardiography (TEE) is easily accomplished with two-dimensional imaging through several standard windows as well as color flow Doppler (CFD) and spectral Doppler analysis. The primary function of these valves is to regulate blood flow from the periphery to the pulmonary vascular bed and to maximize the efficiency of the right ventricle (RV). Although the valves are well seen with transthoracic echocardiographic (TTE) techniques, detailed TEE assessment can add additional information and is invaluable in situations unsuitable for TTE.


STRUCTURE AND FUNCTION OF THE TRICUSPID VALVE

The tricuspid valve (TV) has several important characteristics that differentiate it from the other cardiac valves. It has three thin membranous leaflets that are not supported by a substantial fibrous annulus and are much less distinct, separated more by indentations in a continuous sheet of tissue rather than true commissures. The TV consists of large anterior and septal leaflets and a smaller posterior leaflet, each attached to papillary muscles by way of chordae tendinae and affixed to the annulus and a portion of the RV free wall (Fig. 16.1). The area of the TV, 7-9 cm2, is significantly greater than that of any other valve (1).


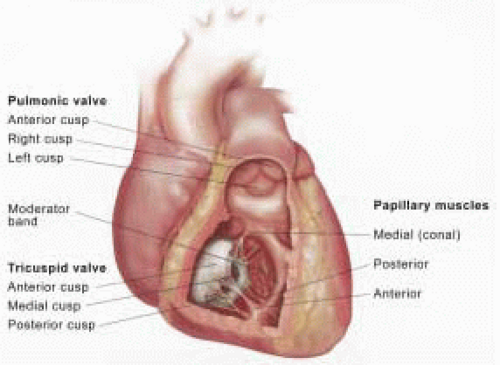
FIGURE 16.1. Anatomic drawing of right ventricle with valves labeled, anterior view. (Reprinted with permission from Konstadt SN, Shernan S, Oka Y, eds. Clinical Transesophageal Echocardiography: A Problem Oriented Approach, 2nd ed. Philadelphia: Lippincott Williams & Wilkins.)

The TV apparatus, while similar to that of the mitral valve, is more complex and variable. The anterior papillary muscle is the largest and arises from a linear band of cardiac muscle that runs perpendicular to the papillary muscle known as the moderator band. It attaches to the ventricular septum near the apex of the right ventricle and may be mistaken for an intracardiac mass (Fig. 16.2). The posterior papillary muscle is frequently small and at times even absent. A diminutive septal papillary muscle is also present (Fig. 16.1). An alternative nomenclature describes two papillary muscles: a right anterior muscle and a posterior muscle that may have multiple heads. The tricuspid
annulus lies in a slightly more apical position than the mitral anulus, with its inferior margin near the entrances of the inferior vena cava and coronary sinus into the right atrium. The contribution of tricuspid annular motion to RV function is quite important. Downward or apical movement of the annulus significantly augments RV stroke volume, even more than the analogous movement of the mitral annulus. With loss of annular motion, systolic shortening of the RV free wall decreases substantially, significantly diminishing effective right heart function (2).


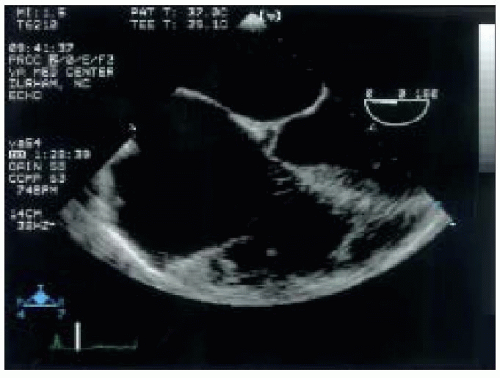
FIGURE 16.2. TEE of modified midesophageal four-chamber view showing the moderator band crossing the apical portion of the right ventricle. Note right atrial enlargement.


STRUCTURE AND FUNCTION OF THE PULMONIC VALVE

The pulmonic valve (PV) is most similar in structure and function to the aortic valve (AV). Due to its position on the right side, a lower pressure system, the pulmonic leaflets are somewhat thinner. The three PV leaflets are termed anterior, left, and right. The latter two are situated posterior to the anterior leaflet and may be more correctly termed the right posterior and left posterior (Fig. 16.1).

The valvular apparatus of the PV consists of the three cusps, their associated sinuses of Valsalva, and a sinotubular junction, similar to that of the aortic valve. This structural similarity is a consequence of their common embryologic origin. Both semilunar valves develop from ridges of subendocardial tissue that form at the orifices of the aorta and the pulmonary trunk after partition of the bulbus cordis and the truncus arteriosus has occurred (3). The annulus of the PV is much more ill-defined and distensible than that of the AV because the pulmonary root attaches directly to RV muscle rather than to a fibrous annular ring. The geometric relationships between the valve annulus and sinotubular junction are similar on the right and left sides of the heart, resulting in a pulmonic sinotubular junction that is 10% to 15% smaller than the PV annulus diameter (4). The pulmonic valve area is similar to that of the AV, approximately 2 cm2/m2. The anterior and right posterior PV leaflets and their associated sinuses of Valsalva are slightly larger than the left posterior (5). Other features common to both the PV and the AV are the nodulus Arantii (small fibrous nodules in the free margin of the cusp) and the lunula (thin half-moon-shaped areas along the free edge of each cusp that can have perforations not considered clinically important) (6).


TRANSESOPHAGEAL ECHOCARDIOGRAPHIC EVALUATION OF THE TRICUSPID AND PULMONIC VALVES


Two-Dimensional and Color Flow Doppler

A complete evaluation of the right-sided valves includes standard two-dimensional (2-D) views, CFD, and spectral Doppler examination of the right-sided chambers, the TV, the PV, and their supporting structures, the vena cavae, the hepatic veins, and the proximal main pulmonary artery (PA). TEE may prove less effective in visualizing the TV and PV compared to the MV and AV due to the anterior location of the right-sided valves. Examination of the TV may be especially difficult in the presence of a calcified or prosthetic mitral annulus, or thickened atrial septum. Furthermore, visualization of all three leaflets of the PV is difficult with either TTE or TEE.

The Society of Cardiovascular Anesthesiologists, in collaborative effort with the American Society of Echocardiography (SCA/ASE), has recently published TEE practice guidelines detailing standard imaging planes useful for evaluating the TV and the PV (7). The relevant views for examination of the right heart, the TV and the PV are listed in Table 16.1. The midesophageal four-chamber (ME 4-C) view is the starting point for assessing the right-sided valves and provides a good view of the TV. In this view, the atria and ventricles, the atrioventricular valves, and the atrial and ventricular septa are well seen. The TV septal leaflet is displayed to the right of the screen, with either the anterior or posterior leaflets to the left, depending on the degree of TEE probe retroflexion (Figs. 16.3A and 16.3B). It may be necessary to advance the probe slightly to optimize this view if the valve is obscured by a calcified or prosthetic AV. Anatomic abnormalities of the TV are easily seen, as well as the relative sizes of the right atrium and ventricle that may result from TV pathology. Color flow Doppler examination of the TV allows assessment of tricuspid regurgitation (TR). The valve should be interrogated throughout its superior-to-inferior
aspect and across its transverse dimension (0, 30, and 60 degrees) to completely map the TR jet and determine the severity of regurgitation. Spectral Doppler examination of the valve may be attempted in this imaging plane, but the angle of interception between the direction of flow and the ultrasound beam may preclude an accurate result. The PV is not visualized in the ME 4-C view.


TABLE 16.1. Suggested Views for Imaging Tricuspid and Pulmonic Valves


View


Transducer Position (degrees)


Right-Sided Structures Imaged


Midesophageal four-chamber


0-10


RA, RV, TV, IAS, IVS


Midesophageal RV inflow-outflow


60-90


TV, RV, RVOT, PV


Midesophageal bicaval


100-120


RA, IAS, SVC, IVC


Modified midesophageal bicaval


120-140


RA, IAS, SVC, IVC, TV


Midesophageal aortic valve short axis


30-60


PV, main PA


Upper-esophageal aortic arch short axis


90


PA, PV, aortic arch


Transgastric TV short axis


0-20


TV (anterior, posterior, and septal leaflets)


Transgastric RV inflow (long axis)


100-120


RV, RA, TV, chordae, papillary muscles


Transgastric hepatic


90-120


Hepatic veins


Transgastric RV outflow


70-90


RVOT, PV


Deep transgastric RV outflow


0


RVOT, PV


PA, pulmonary artery; PV, pulmonic valve; RA, right atrium; RV, right ventricle; TV, tricuspid valve; IAS, interatrial septum; IVS, interventricular septum; RVOT, right ventricular outflow tract; SVC, superior vena cava; IVC, inferior vena cava


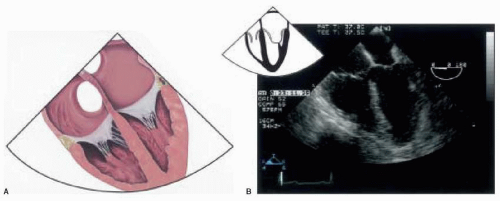
FIGURE 16.3 A: Anatomic drawing of the midesophageal four-chamber view. (Reprinted with permission from Konstadt SN, Shernan S, Oka Y, eds. Clinical Transesophageal Echocardiography: A Problem Oriented Approach, 2nd ed. Philadelphia: Lippincott Williams & Wilkins.) B: TEE of midesophageal four-chamber view with corresponding icon.

At the same midesophageal level, advancement of the transducer multiplane angle to between 60 and 90 degrees will display the midesophageal RV inflow-outflow view. In this view, the posterior leaflet of the TV will appear to the left side of the screen display and the anterior leaflet to the right. In the far right field, the PV is visible, separating the proximal PA and right ventricular outflow
tract (RVOT) (Figs. 16.4A and 16.4B). Rotation of the probe to the left (counterclockwise) may improve the image of the proximal main PA allowing evaluation of its first few centimeters for abnormalities. Of note, although the PV leaflets may not be clearly imaged in this view, CFD may still be used to detect pulmonic regurgitation (PR).


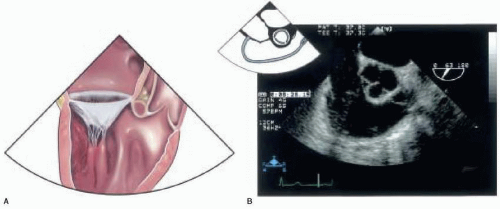
FIGURE 16.4. A: Anatomic drawing of right ventricular inflow-outflow view. (Reprinted with permission from Konstadt SN, Shernan S, Oka Y, eds. Clinical Transesophageal Echocardiography: A Problem Oriented Approach, 2nd ed. Philadelphia: Lippincott Williams & Wilkins, Figure 10.3.) B: TEE of right ventricular inflow-outflow view with corresponding icon.

A third imaging plane for examining RV inflow can be acquired beginning with the midesophageal bicaval view (110-140 degrees of transducer rotation) (Figs. 16.5A and 16.5B) and applying slight counterclockwise probe rotation. The Eustachian valve is often well seen on the left side of the display. In this modified bicaval view, the basal RV and portions of the TV appear in the left far field and allow evaluation of TV inflow and regurgitation (Figs. 16.6A and 16.6B). In addition, the direction of blood flow and the ultrasound beam vector are closely aligned in this view, thereby allowing accurate spectral Doppler assessment of transvalvular flow. Pulsed wave Doppler (PW) analysis of TR peak jet velocity allows estimation of RV and PA systolic pressures (Fig. 16.6C). Also, the severity of
TV stenosis may be assessed using continuous wave (CW) Doppler techniques.


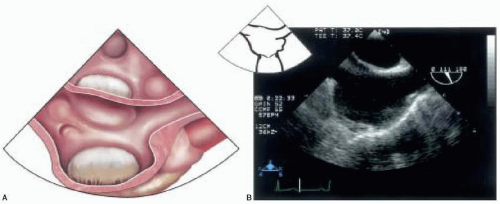
FIGURE 16.5. A: Anatomic drawing of bicaval view. (Reprinted with permission from Konstadt SN, Shernan S, Oka Y, eds. Clinical Transesophageal Echocardiography: A Problem Oriented Approach, 2nd ed. Philadelphia: Lippincott Williams & Wilkins.) B: TEE of bicaval view with corresponding icon.


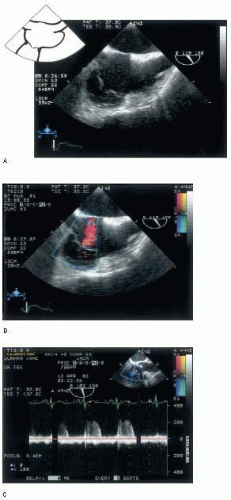
FIGURE 16.6. A: TEE of modified bicaval view with corresponding icon. B: Color Doppler of the tricuspid valve from the modified bicaval view. C: Spectral Doppler interrogation of the tricuspid valve.

Imaging of the PV may be augmented with the midesophageal short-axis view of the AV (ME AV SAX). This view is developed at 30-60 degrees of transducer rotation, with the display showing the PV and the main PA to the right of the AV (Fig. 16.7A). In this scan plane, the right posterior pulmonic leaflet appears posteromedial and the anterior pulmonic leaflet appears more lateral on the display (Fig. 16.7B) (8). This is another excellent view in which to inspect the proximal pulmonary artery for pathology.

Also useful for PV imaging is the upper esophageal (UE) aortic arch short-axis view (Fig. 16.8A). In this window, the PA and the PV appear on the left side of the screen, well aligned in long axis with the ultrasound beam vector (Fig. 16.8Bb). Hence, it is one of the best views for assessing the severity of pulmonic stenosis (PS) and PR. Turning the probe slightly to the left (counterclockwise) and retroflexing may improve the view of the PV. This view provides the best longitudinal assessment of the main PA.

Transgastric (TG) views of the TV are useful, although slightly more difficult to obtain. A short axis of the RV is obtained by visualizing the short axis of the left ventricle and rotating the probe to the right (clockwise). By anteflexing the probe and withdrawing slightly, the three leaflets of the TV come into view, in a manner somewhat analogous to that of the short axis of the leaflets of the mitral valve (Fig. 16.9). The anterior leaflet appears in the left far field, the posterior in the near left, and the septal to the right of the display. The TG RV inflow view is also developed from the TG midpapillary, short-axis view of the left ventricle by turning the probe slightly rightward (clockwise), centering the RV on the display, and advancing the multiplane angle to between 100 and 120 degrees
(Fig. 16.10). This scan plane provides the best view of the TV supporting structures, including the chordae tendinae and papillary muscles. The RV appears on the left, and the RA on the right of the display screen. From this scan plane, the TEE probe can be rotated further rightward (clockwise) to image the hepatic veins, most easily identified with CFD. Pulsed wave Doppler can then be used to evaluate hepatic flow patterns (Fig. 16.11). The PV and the RVOT can also be imaged from this probe location. From the TG RV inflow view at between 100 and 120 degrees, reducing the multiplane angle slowly toward zero and anteflexing brings the RVOT and the PV into view somewhere between 60 and 90 degrees (TG RV outflow view) (Fig. 16.12A) (7). At times, the aortic valve may appear just to the right of the PV, demonstrating the intimate relationship between the two semilunar valves (Fig. 16.12B).


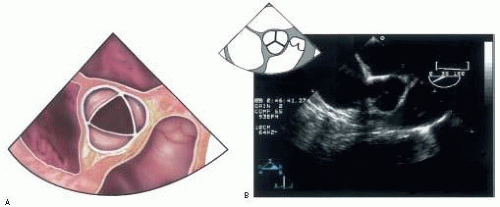
FIGURE 16.7. A: Anatomic drawing of midesophageal aortic valve short-axis view with right ventricular outflow tract seen. (Reprinted with permission from Konstadt SN, Shernan S, Oka Y, eds. Clinical Transesophageal Echocardiography: A Problem Oriented Approach, 2nd ed. Philadelphia: Lippincott Williams & Wilkins.) B: TEE of midesophageal aortic valve short axis with corresponding icon.


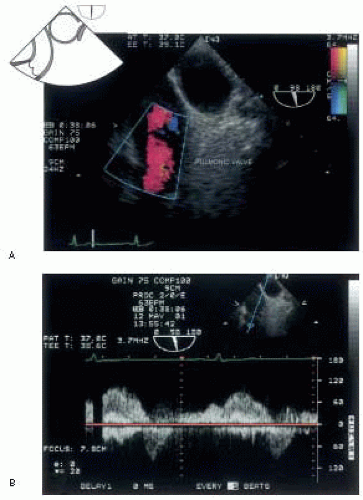
FIGURE 16.8. A: TEE of upper esophageal aortic arch short-axis view with color Doppler flow across the pulmonic valve. B: TEE of upper esophageal aortic arch short-axis view with spectral Doppler across the pulmonic valve demonstrating forward systolic flow and retrograde flow during diastole. (Reprinted with permission from Konstadt SN, Shernan S, Oka Y, eds. Clinical Transesophageal Echocardiography: A Problem Oriented Approach, 2nd ed. Philadelphia: Lippincott Williams & Wilkins.)


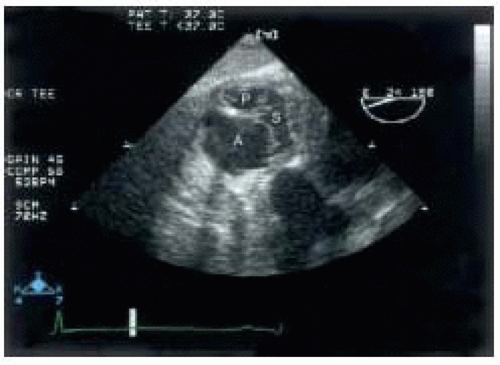
FIGURE 16.9. TEE of tricuspid valve short axis with leaflets labeled. (Reprinted with permission from Konstadt SN, Shernan S, Oka Y, eds. Clinical Transesophageal Echocardiography: A Problem Oriented Approach, 2nd ed. Philadelphia: Lippincott Williams & Wilkins.)


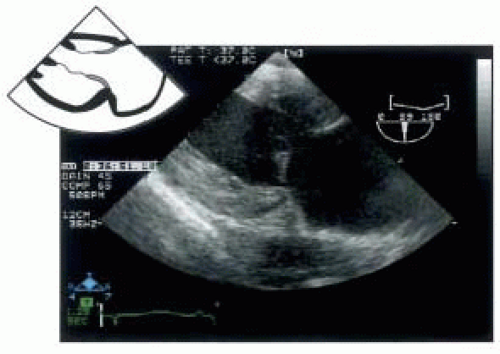
FIGURE 16.10. TEE of transgastric right ventricle view with corresponding icon.


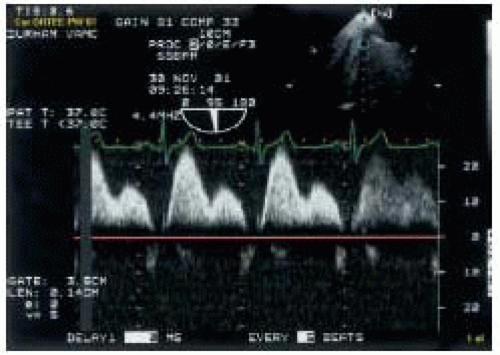
FIGURE 16.11. TEE of normal hepatic venous flow.

Finally, further advancing the TEE probe to the deep transgastric position at zero degrees, rightward (clockwise) probe rotation and anteflexion will reveal another view of the RVOT and the PV (Figs. 16.13A and B). It is important to evaluate the proximal main PA whenever visible, as abnormalities may reflect PV pathology, or be the cause of it.

An additional view, not technically part of TV and PV imaging, is a view of the short axis of the aorta and superior vena cava with the distal portion of the main PA seen to the right of the screen, and the proximal right PA appearing at the top of the screen in long axis. This view is developed from the aortic valve short-axis view by slow withdrawal of the TEE probe until these structures come into view. Often, a pulmonary artery catheter can be seen in both the SVC and the right main PA in this view. The left PA is usually obscured by the bronchial structures.


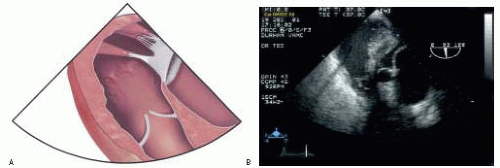
FIGURE 16.12. A: Anatomic drawing of transgastric right ventricular outflow view with pulmonic valve prominent. (Reprinted with permission from Konstadt SN, Shernan S, Oka Y, eds. Clinical Transesophageal Echocardiography: A Problem Oriented Approach, 2nd ed. Philadelphia: Lippincott Williams & Wilkins.) B: TEE of transgastric right ventricular outflow tract on the left and left ventricular outflow tract on the right. The aortic and pulmonic valves are clearly seen.

Any of the echocardiographic imaging artifacts may confound evaluation of the TV and the PV. Especially pertinent to imaging of the right-sided structures, however, are pacing wires and intracardiac catheters that may cause acoustic shadowing or be misinterpreted as intracardiac masses, clots, or vegetations (Fig. 16.14) (9).


Spectral Doppler

Evaluation of flow through the TV and the PV is performed using spectral Doppler techniques. Analysis of tricuspid flow is optimally performed using the modified bicaval view, the ME RV inflow-outflow view, or the ME 4-C view, depending on which view provides the most parallel alignment of flow with the ultrasound beam. The sample volume should be placed between the leaflet tips during diastole to assess diastolic filling patterns. Analogous to transmitral flow, characteristic early (E) wave and A (atrial) wave Doppler peaks correspond respectively to early ventricular filling and late diastolic filling from atrial contraction. From these recordings, E velocity, A velocity, E/A velocity ratio, and E-wave deceleration time may be measured or calculated. Typical pathologic patterns of diastolic dysfunction include impaired relaxation (E image A) and restriction (E image A) of RV filling. It is important to note that tricuspid inflow patterns have lower absolute
velocities than the corresponding mitral inflow velocities owing to the lower pressures generated by the RV and the larger cross-sectional area of the TV.


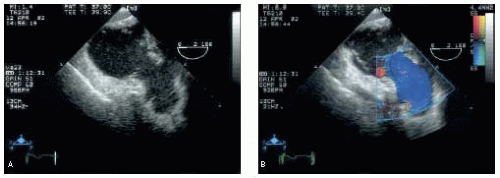
FIGURE 16.13. A: TEE of deep transgastric right ventricular outflow tract. B: TEE of deep transgastric right ventricular outflow view with color flow Doppler demonstrating transpulmonic flow.


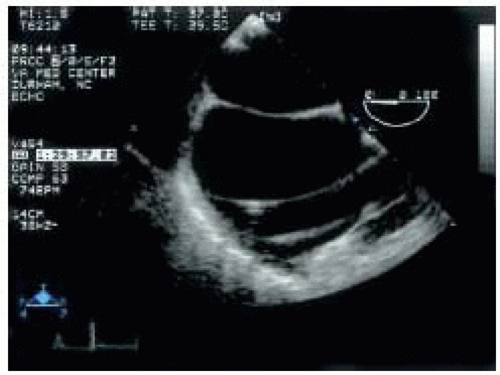
FIGURE 16.14. TEE focused on right atrium to demonstrate the pulmonary artery catheter echographic characteristics.

Useful information concerning TV and RV function may often be obtained by analysis of hepatic venous flow patterns. Normal venous flow in the hepatic veins is similar to pulmonary venous flow, with antegrade systolic (S) and diastolic (D) waves, and a retrograde atrial (A) wave resulting from atrial contraction (Fig. 16.11). At times, an additional small retrograde wave appears at end systole and is termed a V-wave. This additional retrograde wave likely results from tricuspid annular motion at end systole. When right atrial pressure is increased, the S-wave and the S/D ratio decrease while the A-wave increases. Severe TR eliminates the normal antegrade S-wave, and produces a reversed flow signal during systole (Fig. 16.15). In patients with atrial fibrillation no A-wave is seen in the hepatic venous or TV inflow patterns.

Only gold members can continue reading. Log In or Register to continue

Stay updated, free articles. Join our Telegram channel

Jul 15, 2016 | Posted by in CARDIOLOGY | Comments Off on Assessment of the Tricuspid and Pulmonic Valves

Full access? Get Clinical Tree

Get Clinical Tree app for offline access