Assessment of the Mitral Valve


Assessment of the Mitral Valve


Colleen Gorman Koch


The mitral valve is aptly named because of its resemblance to a “mitre,” a type of folding cap consisting of two similar parts that rise to a peak (1,2). During the Renaissance Andreas Vesalius suggested the term mitral because of the valve’s resemblance to a bishop’s mitre (Fig. 14.1) (3,4). His publication of De Humani Corporis Fabrica in 1543 constituted a monumental achievement by presenting anatomy as a scientific discipline, ultimately advancing the knowledge of cardiology (5). The intrigue of mitral anatomy, during an age when studies were done in secret and published at risk to the anatomist, is currently captured by transesophageal echocardiography, which provides a window to real-time structure and function of the heart.


ANATOMY OF THE MITRAL VALVE

Anatomic components of the mitral valve complex include the left atrial wall, the mitral annulus, the anterior and posterior mitral valve leaflets, the chordal tendons, and the anterolateral and posteromedial papillary muscles, which attach the mitral valve to the left ventricular myocardium (6,7,8). The mitral annulus, which exhibits sphincteric contraction in systole, serves as a basal attachment for the mitral valve leaflets (8). The anterior mitral leaflet is somewhat triangular and subtends approximately one-third of the circumference of the mitral annulus. It has a longer basal-to-margin length than the posterior mitral leaflet. Part of the annulus of the anterior mitral leaflet has a common attachment to the fibrous skeleton of the heart with the left coronary cusp and half of the noncoronary cusp of the aortic valve. (4). The posterior mitral leaflet is shorter and subtends a greater attachment to the mitral annulus than the anterior mitral leaflet. The posterior mitral leaflet has a “true bundle of fibrous tissue,” the annulus, separating the left atrium from the left ventricle (6,9,10). While morphologically different, the surface areas of the anterior and posterior mitral valve leaflets are nearly identical (4,6,8,9) and together exceed the area of the mitral annulus in a relationship of greater than two to one (4,8). The mitral valve leaflets adjoin at the sides of the valve, forming the anterolateral and posteromedial commissures (4). More than 120 chordal tendons subdivide as they project from each papillary muscle to attach to the free edge and body of both mitral valve leaflets. Subdivisions of the choral tendons can be classified as primary (first order), secondary (second order), and tertiary (third order) chordae (4).

Standard nomenclature adopted by the Society of Cardiovascular Anesthesiologists and the American Society of Echocardiography divides the anterior and posterior leaflets into three segmental regions (11). Indentations along the free margin of the posterior mitral leaflet give it a scalloped appearance, allowing identification of individual scallops P1, P2, and P3 (6). The anterior mitral leaflet is also divided into three segments located opposite the corresponding segments of the posterior mitral leaflet: A1, A2, and A3. The P1 and A1 segments are adjacent to the anterolateral commissure, while the P3 and A3 segments are adjacent to the posteromedial commissure (Fig. 14.2) (11).


FIGURE 14.1. The mitre typically worn by bishops, popes, and cardinals is depicted alongside a cross-sectional image of the mitral valve. Andreas Vesalius, the father of anatomy, noted the striking similarity between the two while performing anatomic dissections in the sixteenth century.


FIGURE 14.2. Standard terminology as applied to the mitral valve leaflets is illustrated in this image. The anterior and posterior mitral valve leaflets are each divided into three segmental regions.


STRUCTURAL INTEGRITY OF THE MITRAL VALVE


Mitral Regurgitation

The structural integrity of the mitral valve may be compromised by primary valve pathology or secondary disease processes affecting one or more components of the mitral valve apparatus (12). The primary etiology of mitral regurgitation in industrialized countries is from ischemic and degenerative causes (13). Table 14.1 lists a broad range of disease processes that contribute to dysfunction of the mitral valve.


TABLE 14.1. Etiology, Mechanism, and Two-Dimensional Characteristics of Mitral Valve Dysfunction


Etiology


Mechanism


Two-Dimensional Echocardiographic Appearance


Rheumatic heart disease


Retractile fibrosis of leaflet tissue and chordal tendons resulting in failure of leaflet coaptation


Thickened leaflet tissue and chordal tendons, restricted leaflet motion, calcium deposition


Degenerative


Leaflet prolapse, malalignment of leaflet tissue


Prolapsing/flail leaflet tissue


Ischemic (infarction)


Ruptured papillary muscle


Flail leaflet


Myocardial disease


Dilatation of annulus, reduced surface area for coaptation


Normal leaflet tissue, increased annular dimensions


Congenital


Cleft leaflet, transposed valve


Cleft leaflet, tricuspid valve


Endocarditis


Destructive lesions


Perforation, flail leaflets, vegetations


Hyperesoinophilic syndrome


Loss of coaptation


Reduced leaflet motion


Infiltrative disease


Thickened leaflets impair coaptation


Leaflet thickening


Marfan syndrome


Ruptured chordal tendons


Redundant tissue, prolapse, or flail of leaflet tissue


Postradiation


Leaflet thickening impairs coaptation


Thickened leaflets, restrictive leaflet motion


Carcinoid/ergot alkaloids


Fibrosis of leaflets, failure of coaptation


Leaflet thickening and restriction


Modified from Rahimtoola S, Enriquez-Sarano M, Schaff H, Frye R. Mitral Valve Disease. In: Fuster V, Alexander R, O’Rourke R, eds. Hurst’s the Heart. 10th ed. New York: McGraw-Hill 2001, with permission.


Carpentier and colleagues categorized mitral valve dysfunction based on normal, excessive, or restrictive leaflet motion range (14). Mitral insufficiency with normal leaflet motion occurs in patients with congenital clefts in the leaflet tissue or those with leaflet perforation due to endocarditis. Mitral regurgitation due to excessive leaflet motion can result from chordal rupture leading to segmental leaflet prolapse. Loss of leaflet tissue from rheumatic endocarditis may lead to restricted leaflet motion and subsequent mitral insufficiency (Fig. 14.3) (15).


Severity Estimation

Echocardiographic grading of mitral regurgitation, as well as determination of ventricular dimensions and function are integral to clinical decision making with regard to the timing for surgical intervention. Application of severity estimation methods is dependent on the technical expertise of the imaging staff, the complexity involved with the measurement technique, associated limitations with the individual method, and time constraints.

Developed methods of estimation can be partitioned into qualitative, semiquantitative, and quantitative techniques. An integration of these techniques in conjunction with clinical features of the patient’s presentation will provide an accurate assessment of regurgitant severity and need for surgical intervention.


Two-Dimensional Echocardiography

Two-dimensional echocardiography provides anatomic details to assist in delineating the underlying etiology of valve dysfunction. A complete transesophageal echocardiography
(TEE) examination of the mitral valve apparatus and surrounding left ventricular myocardium aid in characterizing valve pathology. Enlargement of the left atrium and increases in the left ventricular systolic and diastolic dimensions are changes detected by two-dimensional echocardiography. Two-dimensional changes suggestive of severe mitral insufficiency include left atrial dimensions of ≥ 5.5 cm and left ventricular diastolic dimensions of ≥ 7 cm (16).


FIGURE 14.3. Carpentier’s classification of range of mitral leaflet motion is depicted in this illustration as normal, restrictive, and excessive leaflet motion, respectively.

The volume overload imposed on the left ventricle is proportional to the severity of mitral regurgitation present. End-systolic chamber size is considered a sensitive marker for imminent ventricular dysfunction. In particular, it is recommended that asymptomatic and symptomatic patients with severe mitral regurgitation and left ventricular end-systolic diameter of ≥ 4.5 cm undergo corrective surgical intervention (17,18). The impact of volume overload on the left side of the heart is also dependent on the acuity of mitral regurgitation. Initial phases of severe mitral regurgitation result in a dilated left ventricle with hyperdynamic function and an end-systolic cavity volume, which is small, compared to the end diastolic volume. Continued volume overload over time will lead to left ventricular dysfunction. Ideally, with echocardiographic guidance, corrective interventions can be implemented prior to the development of significant and irreversible ventricular dysfunction (18).


Qualitative Techniques


Continuous Wave Doppler Signal

Aligning the continuous wave Doppler (CW-Doppler) signal through the mitral regurgitant jet allows visualization of mitral regurgitant signal density and morphology. In general, the signal intensity is reflective of the severity of mitral regurgitation. Mild degrees of mitral regurgitation are detected by CW-Doppler as incomplete envelopes of low CW-Doppler signal intensity, whereas dense complete CW-Doppler signal envelopes of nearly equal intensity to mitral inflow are associated with more severe degrees of mitral regurgitation (Fig. 14.4) (16,19).


Peak E Wave Velocity

Peak E wave velocity as detected with pulsed wave Doppler of the transmitral flow velocity can be qualitatively related to mitral regurgitation severity. When the degree of mitral regurgitation increases, the added regurgitant volume across the mitral valve will increase the pressure gradient between the left atrium and left ventricle. The increase in pressure gradient, in turn, increases the early mitral inflow velocity (20). Thomas and colleagues investigated the use of peak E wave velocity as an initial screening variable to identify hemodynamically significant mitral regurgitation. Peak E wave velocity was compared to a qualitative echocardiographic evaluation by an expert as well as with regurgitant fraction measurements. An E wave velocity of > 1.2 meters per second (m/s) identified patients with severe mitral regurgitation with a sensitivity of 86%, a specificity of 86%, a positive predictive value of 75%, and a negative predictive value of 92% (20).


Semiquantitative Techniques


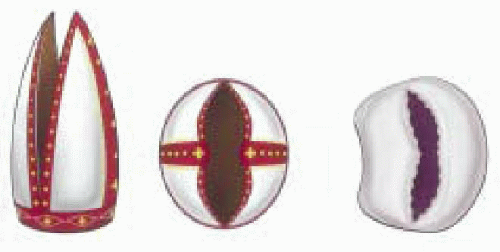
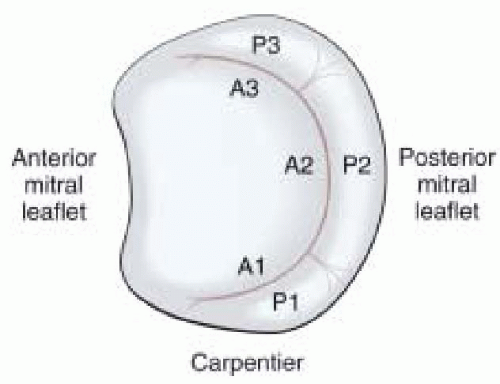
Spatial Area Mapping

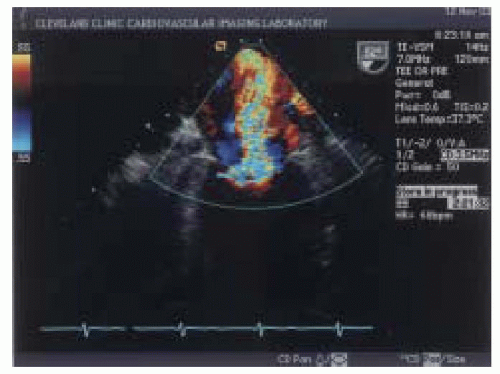
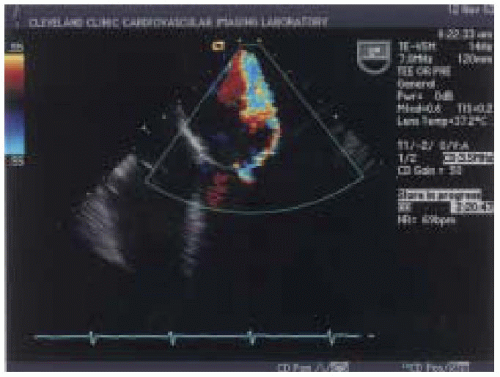
Color flow Doppler is one of the most commonly used semiquantitative methods to estimate the severity of mitral regurgitation (21). Color flow Doppler is based on pulsed wave ultrasound techniques with different signal processing and display formats. Instead of measuring velocities at a single location as with pulsed wave Doppler, color flow Doppler has a number of gates positioned at different depths along many scan lines. Velocity
is encoded into different colors based on the direction of flow to or away from the transducer (22). The extent of the velocity map displayed by color flow Doppler is reflective of the velocity of regurgitant flow rather than absolute regurgitant volume (18). In general, color Doppler can quickly differentiate mild degrees from severe grades of mitral regurgitation (Figs. 14.5 and 14.6).


FIGURE 14.4. Continuous wave Doppler displays a mitral regurgitant jet as a spectral profile represented above the baseline. This regurgitant signal is of nearly equal intensity to antegrade flow through the mitral valve. This qualitative assessment is consistent with the patient’s severe degree of mitral insufficiency.

Color flow Doppler estimates of mitral insufficiency correlate well with the semiquantitative angiographic grades of insufficiency (21). Castello and colleagues compared the correlation between color flow Doppler regurgitant jet area measurements to angiography. A maximal jet area < 3 cm2 predicted mild mitral regurgitation with a sensitivity of 96%, a specificity of 100%, and a predictive accuracy of 98%; whereas a maximal regurgitant area of > 6 cm2 predicted severe regurgitation with a sensitivity of 91%, specificity of 100%, and predictive accuracy of 98% (23).

Spain and colleagues also reported a good correlation between maximal color flow Doppler jet area and angiographic grades of mitral insufficiency. However, they reported limited correlation between quantitative measurements of mitral regurgitant severity, such as regurgitant volume and regurgitant fraction, with maximal jet area measurements (24).

Rivera and colleagues compared a visual assessment method, the color flow Doppler jet area method, and regurgitant fraction measurements for grading the severity of mitral regurgitation. The visual assessment method encompassed integrating information about actual jet dimensions and jet eccentricity as well as chamber geometry to provide an educated assessment of the degree of regurgitation present. They reported that the visual grading method had a better correlation with quantitative measures of regurgitation than jet area measurements (25).


FIGURE 14.5. The midesophageal long-axis image of the mitral valve displays a mild grade of mitral insufficiency as represented with color flow Doppler imaging.


FIGURE 14.6. The midesophageal two-chamber view depicts severe mitral insufficiency with color flow imaging. The color flow signal extends to the posterior left atrial wall and displays an area of flow convergence on the left ventricular side of the mitral valve.

Several technical factors influence the appearance of the color flow signal within the left atrium. Among these are instrumentation settings, such as frame rate, gain settings, and transducer frequency (22). Alterations in colorscale settings impact the effect of entrainment of left atrial blood on the regurgitant jet area. Setting the color scale to the highest possible level will limit the effect of entrainment (26). Maintaining constant technical factors reduces instrumentation errors.

Alterations in intraoperative hemodynamics also influence the jet of mitral regurgitation as detected by color flow Doppler (27,28). Grewal and colleagues (27) reported that slightly more than half of patients with mitral insufficiency improved at least one grade with the induction of general anesthesia. Decreased intravascular volume coupled with a reduction in afterload was thought to contribute to better leaflet coaptation and reduced valvular insufficiency (27).

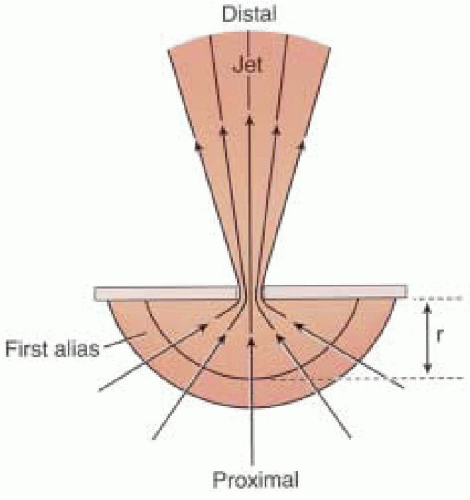
Compliance and size of the receiving chamber confound the relationship between the size of the regurgitant jet and regurgitant volume (24). Patients with acute, severe mitral regurgitation may display a relatively small jet area secondary to high left atrial pressures due to limited compliance of the left atrium (18).

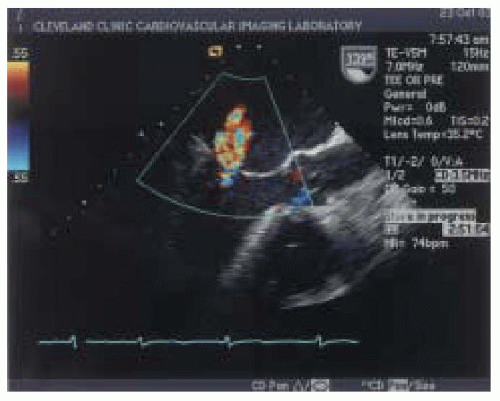
Eccentric regurgitant jets when imaged by color-flow mapping commonly occupy less overall area compared to jets of similar flow rates directed centrally within the left atrium (29). An eccentric jet has a different observed morphology as compared to free jets secondary to limited expansion due to impingement of the jet along the atrial wall. Consideration of jet morphology in the color flow
Doppler assessment is important to avoid underestimating the degree of regurgitation (Fig. 14.7) (29).


FIGURE 14.7. Anterior mitral leaflet prolapse results in an eccentric jet of mitral insufficiency as displayed with color flow imaging from the midesophageal imaging plane. Note the jet of mitral insufficiency is posteriorly directed.


Pulmonary Venous Waveform Patterns

Normal pulmonary venous waveform patterns consist of a biphasic forward systolic waveform occurring during ventricular systole, a forward diastolic velocity waveform that occurs after mitral valve opening, and a retrograde atrial flow reversal waveform that occurs in response to atrial contraction (30). In general, the normal pattern of pulmonary venous flow displays the ratio of systolic waveform to diastolic waveform as greater than or equal to one. Current applications for pulmonary venous waveform patterns include differentiating constrictive pericarditis from constriction, estimation of left ventricular filling pressures, evaluation of left ventricular diastolic dysfunction, and grading the severity of mitral regurgitation (31).

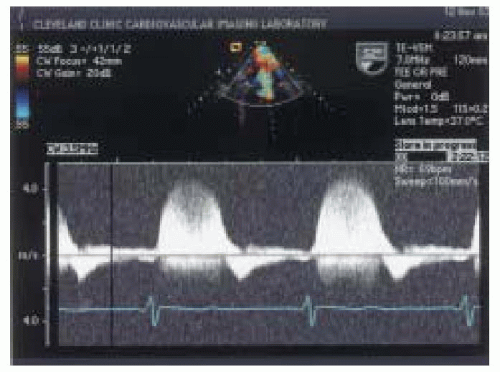
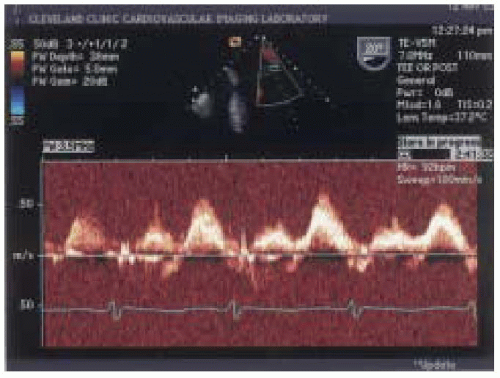
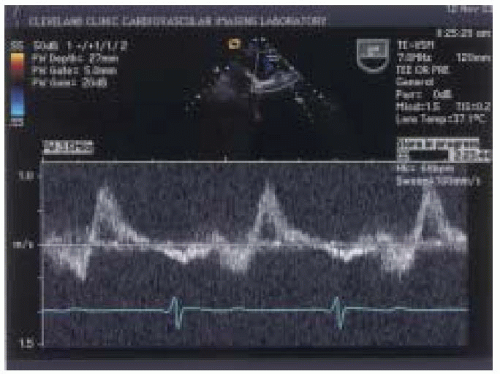
Significant degrees of mitral regurgitation increase left atrial pressure and alter forward flow through the pulmonary veins. Klein and colleagues (32) investigated the relationship between the ratio of peak systolic and peak diastolic flow velocities in the pulmonary veins to varying degrees of mitral regurgitation as measured with TEE color-flow mapping. The ratio of peak systolic and diastolic pulmonary venous waveform velocities were categorized as having a normal pattern where the ratio of peak systolic/diastolic waveform was greater than or equal to one, a blunted pattern where the ratio of peak systolic to peak diastolic waveform was between 0 and < 1 (Fig. 14.8), and reversed systolic waveform represented by a peak systolic velocity value of < 0 (Fig. 14.9). The sensitivity and specificity for reversed systolic flow detecting 4-plus mitral regurgitation was 93% and 100%, respectively. Blunted systolic flow for detecting 3-plus mitral regurgitation had lower sensitivity and specificity of 61% and 97%, respectively (32).


FIGURE 14.8. A pulsed wave Doppler sample volume placed within the left upper pulmonary vein reveals a Doppler velocity profile that displays a blunted pulmonary venous waveform pattern.

Pulmonary venous flow patterns may not be a reliable marker of valvular insufficiency for all grades of mitral regurgitation. Pu and colleagues evaluated the relationship between pulmonary venous flow patterns and quantitative indexes of mitral regurgitation in patients with variable degrees of left ventricular function. Quantitative Doppler
measurements included regurgitant orifice area, regurgitant stroke volume, and regurgitant fraction measurements. A normal pulmonary venous waveform pattern had a sensitivity, specificity, and predictive value for detecting a small regurgitant orifice area of less than 0.3 cm2 of 60%, 96%, and 94%, respectively. The reversed pattern was a highly specific marker for detecting a large regurgitant orifice area of greater than 0.3 cm2 with a sensitivity, specificity, and predictive value of 69%, 98%, and 97%, respectively. The blunted pattern was seen in all grades of mitral regurgitation and had low predictive value for grading the severity of mitral regurgitation, particularly in patients with left ventricular dysfunction (33).


FIGURE 14.9. This pulsed wave Doppler profile of the left upper pulmonary vein reveals systolic flow reversal as represented by systolic flow beneath the baseline, which is consistent with severe mitral insufficiency.

Hynes and colleagues reported similar results regarding usefulness of systolic flow reversal as an indicator of severe mitral regurgitation and a normal waveform pattern confirming the absence of significant mitral regurgitation. They reported that the blunted pulmonary venous waveform pattern was more likely associated with left ventricular abnormalities than mitral regurgitation (34).

Pulmonary venous flow patterns are influenced by a number of factors that include changes in myocardial relaxation (35), abnormal left ventricular compliance, systolic and diastolic dysfunction, changes in loading conditions, and left atrial compliance and function (30,31, 36,37,38,39,40,41). Other cardiac states that alter pulmonary vein flows include arrhythmias, such as atrial fibrillation (31,42).

Klein and colleagues, in a separate investigation, highlighted the importance of sampling both pulmonary veins when grading mitral regurgitation by TEE. They assessed the variability between left and right pulmonary venous flow in the assessment of mitral regurgitation. Discordant pulmonary venous flow as measured by PW Doppler TEE occurred between the left and right upper pulmonary veins at a rate of 37% in those patients with 4-plus mitral insufficiency (43).

Schwerzmann and colleagues reported that combined transmitral E wave velocity and reversed systolic pulmonary venous flow were accurate measures for the determination of moderately severe to severe mitral regurgitation as compared to regurgitant fraction. They reported that reversed systolic pulmonary venous flow with an increased E wave velocity of > 1m/s had the sensitivity of 78% and a specificity of 97% for detecting severe mitral regurgitation (100).


Quantitative Techniques

Among the rationale for the use of quantitative measurements to grade mitral regurgitation are the associated limitations with semiquantitative grading methods. Others have recommended the use of quantifiable methods for patients with greater than mild degrees of mitral regurgitation (45).


Vena Contracta

The vena contracta is the narrowest part of the regurgitant jet as imaged with color-flow mapping as the jet emerges from the regurgitant orifice. The flow pattern in the region of the vena contracta is organized into a series of parallel flow lines. As flow gradually moves away from the vena contracta it becomes more turbulent and disorganized secondary to entrainment of blood by the regurgitant jet within the left atrium (18).

Hall and colleagues compared the accuracy of the vena contracta width to regurgitant volume and regurgitant orifice area measurements in evaluating the severity of mitral regurgitation. They reported a good correlation between vena contracta measurements and quantitative measures of mitral regurgitation severity. In particular, a vena contracta width of ≥ 0.5 cm was always associated with a regurgitant volume > 60 ml and a regurgitant orifice area > 0.4 cm2. A vena contracta width of ≤ 0.3 cm predicted a regurgitant volume of < 60 ml and regurgitant orifice area of < 0.4 cm2. They reported a weak correlation between jet area and quantitative measures of mitral regurgitant severity (46).

Grayburn and colleagues reported that the width of the mitral regurgitant jet at its vena contracta was an accurate marker for severe mitral regurgitation. A width of greater than or equal to 6 mm identified angiographically severe mitral regurgitation with a sensitivity and specificity of 95% and 98%, respectively (47).

Limitations of vena contracta measurements include the associated difficulties with localizing the area of the vena contracta and trouble with obtaining good image quality (18). In addition, there are problems regarding axial versus lateral resolution of the ultrasound imaging system (18). This measurement technique is limited by the lateral resolution of color Doppler, which often is unable to distinguish minor variations in the width of the vena contracta (48).


Regurgitant Orifice Area

The regurgitant orifice area is a reliable quantitative measure of the severity of mitral regurgitation. It can be measured with two-dimensional and pulsed Doppler echocardiography (49) or with the proximal isovelocity surface area (PISA) method (50,51,52). The PISA method applies the continuity principle to color Doppler mapping in the region of the mitral valve orifice where flow converges toward the mitral regurgitant orifice on the left ventricular side of the mitral valve. As blood flow converges toward the mitral regurgitant orifice it forms a series of isovelocity shells whose surface area is hemispheric in shape (Fig. 14.10) (16,52,53,54,55,56,57). Color flow Doppler displays a measure of velocity at a specific distance from the regurgitant orifice (Fig. 14.11). By the law of conservation of mass, flow at each layer should be equal to orifice flow because it must all pass through the orifice (53). The
maximal instantaneous flow rate can be calculated as the product of the surface area of the hemisphere and the aliasing velocity (Va)


FIGURE 14.10. This illustration of a mitral regurgitant jet depicts the hemispheric shape of the flow convergence region. Where r represents the distance from the regurgitant orifice to the first aliasing boundary.

Flow Rate = 2 πr2 × Va

where r is the distance from the regurgitant orifice to the proximal portion of the flow convergence region. Once the maximal instantaneous flow rate is calculated the regurgitant orifice area (ROA) can be calculated as:

Only gold members can continue reading. Log In or Register to continue

Stay updated, free articles. Join our Telegram channel

Jul 15, 2016 | Posted by in CARDIOLOGY | Comments Off on Assessment of the Mitral Valve

Full access? Get Clinical Tree

Get Clinical Tree app for offline access