Assessment of Myocardial Viability by Contrast Enhancement


Assessment of Myocardial Viability by Contrast Enhancement


Lowie M.R. Van Assche

Han W. Kim

Raymond J. Kim


INTRODUCTION


BACKGROUND

The concept that dysfunctional myocardium may be viable has been known for decades. Specific physiologic states that can result in dysfunctional, yet viable myocardium are stunning and hibernation. “Myocardial stunning” describes the state of post-ischemic myocardial dysfunction in the presence of relatively normal blood flow (1). On light microscopy, stunned myocardium appears normal. However, there is decreased adenosine triphosphate and subtle ultrastructural abnormalities (2). The mechanism underlying stunning is not completely understood but has been proposed to involve myo-filament desensitization to calcium, possibly by initial calcium overload during reperfusion, leading to troponin-I proteolysis and/or oxygen radical formation during ischemia-reperfusion damaging the contractile cell membranes. In general, stunned myocardium has been shown to recover function within hours to days, and recovery may take longer in cases of longer isch-emic episodes prior to revascularization (3).

The term “myocardial hibernation” describes the state of chronic myocardial dysfunction at rest that can be partially or completely restored to normal either by improving blood flow and/or by reducing demand (4). This physiology was first noted when ventricular wall motion abnormalities improved after coronary artery bypass grafting (CABG) (5,6 and 7). Biopsy specimens from regions of dysfunctional myocardium that recovered function after CABG showed that ˜90% of the volume consisted of viable cells (8,9). However, increased glycogen is seen in areas previously occupied by myofilaments and small mitochondria are present (10). The mechanism underlying hibernating myocardium is not completely understood but many investigators believe it is due to a chronic reduction in resting coronary blood flow. Others suggest that blood flow is normal in hibernating myocardium, and that the dysfunction results from repetitive episodes of stunning (10). In contrast to the relatively early recovery of function seen with myocardial stunning, recovery of function has been shown to take up to 1 year after revas-cularization in myocardial hibernation (3). Thus, myocar-dial stunning and hibernation both represent myocardium that is alive (or viable), rather than dead (or nonviable).


CLINICAL IMPORTANCE OF MYOCARDIAL VIABILITY

In the acute setting following an episode of myocardial ischemia and reperfusion, there are several reasons why it
is important to distinguish between stunned and infarcted myocardium. First, the patient prognosis is changed. Several studies have shown that patients with acute ventricular dysfunction primarily resulting from myocardial necrosis have a worse prognosis than patients with ventricular dysfunction that is primarily reversible (11,12). Second, patient management during the acute setting may be changed. Viable but injured myocardium, such as stunned myocardium, is potentially at risk for future infarction if the reperfusion therapy was not complete and significant stenosis remains (11,13). In addition, a determination of the extent of nonviable and viable myocardium across the ventricular wall in a dysfunctional region may be valuable in selecting patients most likely to benefit from therapy that can modulate ventricular remodeling after acute myocardial infarction (MI), such as angiotensin-converting enzyme inhibitors and beta-blockers (14). Third, infarct size determined accurately in the acute setting may prove to be an adequate surrogate endpoint for the assessment of new therapies (15,16). For example, the efficacy of experimental therapies for acute coronary syndromes or acute MI could be evaluated without the need for “mega” trials with large sample sizes that use mortality as an endpoint. It is expected that the number of drug and device trials that employ cardiac magnetic resonance imaging parameters as a primary endpoint will increase substantially in the future (17).
In the setting of chronic coronary artery disease (CAD), determining which patients will benefit from revascularization is of obvious clinical importance. Guidelines for revasculariza-tion are provided by the American College of Cardiology and American Heart Association (ACC/AHA), last updated in 2011 (18). In patients with chronic CAD, surgical revascu-larization is given a Class I recommendation (evidence/agreement that treatment is useful/efficacious) to improve survival in patients with the following coronary anatomy: Significant (≥50% diameter stenosis) left main coronary artery stenosis (1); significant (≥70% diameter) stenosis in three major coronary arteries or in the proximal LAD plus one other major coronary artery (18). These recommendations are based largely upon data from randomized trials that focused primarily on the angiographic appearance of CAD. While these studies showed benefit in the overall population with severe angiographic disease, in patients with left ventricular (LV) dysfunction, from a mechanistic point of view, one might expect that additional information such as the presence or absence of extensive viable myocardium could improve patient risk stratification for revascularization.

The potential importance of myocardial viability testing in reference to prognosis after revascularization has been evaluated in many small, single-center studies including a meta-analysis demonstrating decreased annual mortality in patients with viability undergoing revascularization compared to those not undergoing revascularization (19). Allman et al. (20), in a meta-analysis of 24 studies, which included 3,088 patients with a mean left ventricular ejection fraction (LVEF) of 32%, concluded that in patients with significant viability (as determined by thallium perfusion imaging, F-18 fluorodeoxyglucose metabolic imaging, or dobutamine echocardiography), revas-cularization was associated with 79.6% reduction in annual mortality compared with medical treatment (3.2% vs. 16%, p < 0.0001). Conversely, in patients without viability, mortality rates were similar for revascularization and medical therapy (7.7% vs. 6.2%, p = NS).

Based on data such as these, the ACC/AHA guidelines on the diagnosis and management of heart failure from 2009 and CABG surgery from 2011 state that CABG, in addition to those with the coronary anatomy described above, may be performed in patients with LV dysfunction (35% to 50%) and significant CAD if the target vessels supply a large area of viable myocardium (Class IIa recommendation [weight of evidence/opinion is in favor of usefulness/efficacy]) (18,21). In contrast, CABG is not recommended in patients with only mild ischemia or only a small area of viable myocardium (Class III recommendation [evidence/agreement that treatment is not useful/efficacious or may be harmful]). However, the evidence for these recommendations has limitations. First, studies were small, not randomized, observational, and retrospective leading to potential patient selection bias. Second, the methodology and criteria for defining viability, as well as the treatment regimens were not standardized among the different studies. Finally, the success and completeness of myocardial revascularization was not investigated by follow-up angiography or stress imaging data in most studies (19). Given these flaws, meta-analyses incorporating these data are subject to the same limitations. In part, due to these limitations, the Surgical Treatment for Ischemic Heart Failure trial (STICH) was undertaken (22).

STICH was a randomized, multicenter, nonblinded trial funded by the National Heart, Lung, and Blood Institute (22). Patients with angiographic documentation of CAD amenable to surgical revascularization and LV systolic dysfunction (ejection fraction [EF] ≤35%) were eligible for enrollment. Exclusion criteria were left main stenosis >50%, cardiogenic shock, MI within 3 months, and need for aortic valve surgery. In hypothesis 1, enrolled patients were randomly assigned to receive medical therapy alone or medical therapy plus CABG. In hypotheses 2, enrolled patients were randomly assigned to receive medical therapy plus CABG or medical therapy plus CABG and surgical ventricular reconstruction. Between 2002 and 2007, 1,212 patients from 99 centers in 22 countries were enrolled in hypothesis 1. The primary endpoint was death from any cause. In the initial design of the STICH trial, viability testing with single-photon emission computed tomography (SPECT) was required. However, this requirement proved to be an impediment to study enrollment. Therefore, the protocol was revised in 2004 to make viability testing optional and the decision to perform the test was left up to the recruiting investigators. In addition, the viability test options were expanded to include SPECT (four separate protocols), dobutamine stress echocardiography (DSE) (23), or both (24).

Overall, there was no significant difference between patients with medical therapy alone and medical therapy plus CABG with respect to the primary endpoint of death from any cause at a median of 5.1 years of follow-up (22). In the 601 patients who received a viability study, there was a significant association between viability and outcome on univariate analysis, but not on multivariate analysis. Surprisingly, the assessment of myocardial viability did not identify patients with a differential survival benefit from CABG, as compared with medical therapy alone, in contrast with the prior literature (24).


The authors point out that conclusions drawn from STICH are limited by a number of factors (24). First, slightly less than half of the 1,212 patients enrolled in the hypothesis 1 comparison underwent viability testing. Second, patients were not randomized to viability testing, and third, testing could have been performed prior to, on the day of, or after study enrollment. These factors may have led to patient selection/enrollment bias and influenced subsequent clinical decision making. In addition, only a small percentage of patients were deemed not to have viable myocardium (19%), which limited the power of the analysis to detect a differential effect of CABG, as compared with medical therapy alone, in patients with myocardial viability as compared to those without viability. Lastly, the viability analyses were limited to SPECT and DSE imaging. While the results were similar for SPECT and DSE, caution should be taken to not extrapolate these results to other imaging modalities that were not tested in STICH, such as positron emission tomography (PET) and delayed enhancement magnetic resonance imaging (DE-MRI). Despite these limitations, the STICH trial is a landmark investigation that raises an important question—is viability assessment important? From a patho-physiologic viewpoint, it would be difficult to interpret the STICH results as concluding that alive myocardium is the same as dead myocardium. On the other hand, from a clinical viewpoint, the STICH results show that using “status quo” viability methods to determine who will benefit from CABG is highly problematic. As a result, there clearly is a need to reassess the underlying mechanisms regarding how viability tests are assumed to work and are interpreted.


SCOPE OF THE CHAPTER

In this chapter we focus on a contrast MRI technique—delayed enhancement magnetic resonance imaging (DE-MRI)—to assess myocardial viability. We will start, however, with the basic definition of myocardial viability. Although the definition may appear to be self-evident, we will find that discrepancies between the results of DE-MRI and other clinical indexes of viability may arise because of assumptions concerning the definition of viability. We proceed by providing a comprehensive overview of the technical aspects of DE-MRI, followed by a review of the original pathophysiologic validation studies. We then demonstrate the clinical application of DE-MRI and compare this technique to other clinically available modalities used to assess myocardial viability. Next, we explore what might constitute the “ideal” technique for assessing viability in order to get insight into physiologic as well as technical limitations that exist. Finally, we examine common assumptions in the metrics used to evaluate viability techniques, and finish with a general summary of the clinical interpretation process.


DEFINITION OF MYOCARDIAL VIABILITY

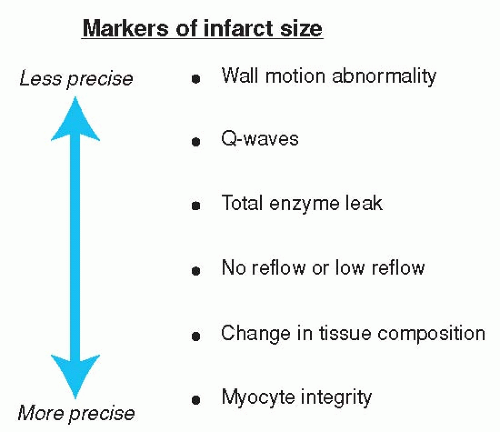
Before any technique used to identify myocardial viability can be evaluated, a definition of viability is required. The definition of viability is directly related to that of MI because infarction results in the loss of viability. A number of techniques are available in the clinical setting to determine whether or not infarction has occurred and if so, how much of the injured territory is not yet infarcted and can be salvaged. In a recent review article, Kaul (25) summarized clinical markers of infarct size and ranked them from least to most precise (Fig. 17.1). As discussed previously, observation of a wall motion abnormality alone does not provide information regarding viability because both stunned and hibernating myocardium are dysfunctional. The electrocardiogram (ECG), although useful, is recognized as being insensitive to infarction because patients with smaller infarcts may demonstrate minimal ECG changes during the acute event and often will not have Q-waves chronically. Serum markers such as creatine kinase (CK) and troponin-I or T can be extremely useful but even these are associated with several limitations. For example, CK and troponin levels may exhibit differing time courses depending on whether or not reperfusion has occurred (26), and neither can be used to localize the infarction to a specific coronary artery territory. Perhaps, most importantly, serum levels of CK and troponin are not elevated beyond the first few days (27), precluding the detection of older infarcts.


Figure 17.1. Clinical and physiologic markers to determine the size of infarction. (Adapted from Kaul S. Assessing the myocardium after attempted reperfusion: Should we bother? Circulation. 1998;98(7):625-627, with permission.)

According to Kaul (25), the most precise way to define infarction, and therefore the loss of viability, is to determine whether or not myocyte death has occurred. All ischemic events prior to cell death are at least in principle reversible; therefore, the further we deviate from a direct assessment of cell death, the more imprecise we become in defining infarction. Likewise, the most precise definition of myocardial viability is the presence of living myocytes. The presence or absence of living myocytes can be readily established in tissue specimens by light microscopy, electron microscopy, or by the use of histologic stains such as triphenyl tetrazolium chloride (TTC) (28). Testing for viability by microscopy or histologic staining, however, is obviously not practical in a clinical setting. Accordingly, a number of less precise definitions of viability that are based on parameters more easily measured in patients have been developed (Table 17.1).


TABLE 17.1 Common Clinical Definitions of Myocardial Viability


Improvement in contraction after revascularization


Improvement in contraction with low-dose dobutamine


Preserved perfusion


Preserved radionuclide tracer uptake


Preserved glucose uptake


Preserved wall thickness and/or thickening


In the literature, viability is often defined as improvement in contractile function after coronary revascularization. This definition is frequently the clinical “gold standard” to which imaging techniques are compared. Although convenient for clinical purposes, this definition can be inaccurate. If contractile function improves after revascularization, it is safe to assume that there is a significant amount of viability; however, the converse is not true. In fact, analysis of transmural needle biopsy specimens taken during CABG demonstrated that some regions that did not improve after revasculariza-tion did have a significant amount of viability. For example, Dakik et al. (8) reported that the extent of viability was nearly 70% of total myocardium in their samples.

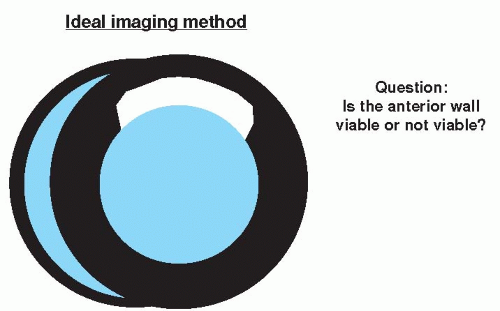
Since the correct definition of viability is the presence of living myocytes, the ideal imaging method for assessing viability should be able to delineate infarcted tissue from viable tissue with high spatial resolution. Unfortunately, currently available techniques, such as SPECT, PET, and DSE, have various limitations. First, what is measured is not the direct presence and exact quantity of viable myocytes, but rather a physiologic parameter, such as contractile reserve or perfusion that has only an indirect relationship to viability. Second, there are technique-specific limitations, including partial volume effects due to poor spatial resolution (SPECT, PET), attenuation and scatter artifacts (SPECT), errors in registration between comparison images, and the occasional inability to visualize all parts of the LV myocardium. Third, all of these techniques interpret viability as an all-or-none phenomenon within a myocardial region since none can assess the transmural extent of viability across the ventricular wall. Figure 17.2 demonstrates the discrepancy that can arise due to this limitation. In this particular example, assessment of the anterior wall using current clinical methods and definitions will be incorrect regardless of whether the anterior wall is determined to be viable or not viable since the correct assessment is that the subendocardial half of the wall is not viable and the epicardial half is viable. This will be discussed in more detail later in the chapter.


DELAYED ENHANCEMENT MAGNETIC RESONANCE IMAGING


BACKGROUND

The phenomenon of delayed hyperenhancement was first described over 20 years ago (29). Several excellent reviews of the literature concerning the interpretation of myocardial hyperenhancement before the development of the segmented inversion recovery sequence have been previously published (30,31). The primary action of most MRI contrast agents currently approved for use in humans is to shorten the longitudinal relaxation time (T1). Accordingly, the goal of most MRI pulse sequences used for the purpose of examining contrast enhancement patterns is to make image intensities a strong function of T1 (T1-weighted images). Early approaches to acquiring T1-weighted images of the heart often used ECG-gated spin-echo imaging in which one k-space line was acquired during each cardiac cycle. Since the duration of the cardiac cycle is comparable with the myocardial T1 (~800 milliseconds), the resulting images were T1-weighted. Following the administration of gadolinium contrast, myocardial T1 was shortened and image intensities increased. Using this approach, a number of investigators reported that as image intensities increased throughout the heart, regions associated with acute MI became particularly bright (hyperenhanced) on a timescale of minutes to tens of minutes after contrast administration (32,33,34,35,36,37 and 38). The use of ECG-gated spin-echo imaging, however, has several intrinsic limitations that adversely affect image quality. One such limitation is the need for relatively long acquisition times (minutes), which introduces artifacts caused by respiratory motion.


Figure 17.2. Cartoon showing infarction of the subendocardial half of the anterior wall (white area). See text for details.


CURRENT TECHNIQUE

Since the early use of ECG-gated spin-echo imaging, a number of improvements have been made. One of the most important among these is the use of segmented k-space (39), in which multiple k-space lines are acquired after each cardiac cycle. As a result, imaging times are reduced to the point at which an entire image can be acquired during a single breath-hold (~8 seconds), thereby eliminating image artifacts caused by respiration. In addition, preparation of the magnetization before image acquisition with an inversion pulse significantly increases the degree of T1-weighting in the images. The segmented inversion recovery pulse sequence was compared with nine other pulse sequences in a dog model of acute MI (40). Table 17.2 summarizes the literature in humans and in in vivo large animal models regarding the depiction of infarcted regions by gadolinium-enhanced MRI prior to the development of the segmented inversion
recovery sequence. From 1986 to 1999, image intensities in “hyperenhanced” regions were generally 50% to 100% higher than normal regions. The use of a segmented inversion recovery pulse sequence with the inversion time (TI) set to null signal from normal myocardium increased this differential approximately 10-fold to 1,080% in animals and 485% in humans (labeled “New Technique” in Table 17.2).


TABLE 17.2 Percentage Elevations in MR Signal Intensity of Infarcted Versus Normal Myocardium and Voxel Sizes: Previous Studies Compared With New Technique


Canine


Human


Year


Reference


Techniquea


Breath-hold


ΔI/R(%)b


Voxel Size(mm3)


ΔI/R (%)b


Voxel Size(mm3)


1986


Rehr et al. (37)


Spin-echo


No


80


NS


1986


Tscholakoff et al.g


Spin-echo


No


70


NS


1986


Eichstaedt et al. (32)


Spin-echo


No


42c


29.3d


1988


de Roos et al.h


Spin-echo


No


60


29.3d


1989


de Roos et al.i


Spin-echo


No


36


29.3d


1990


van der Wall et al. (41)


Spin-echo


No


32c


31.3d


1991


van Dijkman et al. (42)


Spin-echo


No


31c


27.5


1991


Matheijssen et al. (33)


Spin-echo


No


42


29.3d


1994


Fedele et al. (43)


Spin-echo


No


41c


29.3d


1995


Lima et al. (44)


MD-SPGRE


Yes


103c


33.3


1995


Judd et al. (45)


MD-SPGRE


Yes


123e


39.6


1998


Ramani et al. (46)


MD-SPGRE


Yes


58e


30.8


1999


Pereira et al.j


MD-SPGRE


Yes


19e


14.7


1999


Rogers et al. (47)


Single-shot inversion recovery GRE


Yes


39


54.9f


Mean of previous studies


86


27.2


48


32.4


New Technique


Simonetti et al (40)


Segmented inversion recovery GRE


Yes


1,080


6.2


485


16.8


a All images were acquired in vivo at least 5 minutes after the administration of an U.S. Food and Drug Administration-approved MR imaging contrast agent.

b AI/R = percent elevation in MR signal intensity of infarcted myocardium compared with normal myocardium.

c Published data were reported as precontrast versus postcontrast values; values in Table 17.2 were calculated as follows: (Postcontrast value – precontrast value)/precontrast value.

d Assuming a field of view of 320 mm.

e Estimated from data reported in graphical format.

f Assuming a rectangular (6/8) field of view.

g Tscholakoff D, Higgins CB, Sechtem U, et al. Occlusive and reperfused myocardial infarcts: Effect of Gd-DTPA on ECG-gated MR imaging. Radiology. 1986;160:515-519.

h de Roos A, Doornbos J, van der Wall EE, et al. MR imaging of acute myocardial infarction: Value of Gd-DTPA. AJR Am J Roentgenol. 1988;150:531-534.

i de Roos A, van Rossum AC, van der Wall E, et al. Reperfused and nonreperfused myocardial infarction: Diagnostic potential of Gd-DTPA-enhanced MR imaging. Radiology. 1989;172:717-720.

j Pereira RS, Prato FS, Sykes J, et al. Assessment of myocardial viability using MRI during a constant infusion of Gd-DTPA: Further studies at early and late periods of reperfusion. Magn Reson Med. 1999;42:60-68.


MD-SPGRE, magnetization-driven spoiled gradient-echo; NS, not stated; GRE, gradient-recalled echo.


Adapted from Simonetti OP, Kim RJ, Fieno DS, et al. An improved MR imaging technique for the visualization of myocardial infarction. Radiology. 2001;218:215-223.


PULSE SEQUENCE TIMING

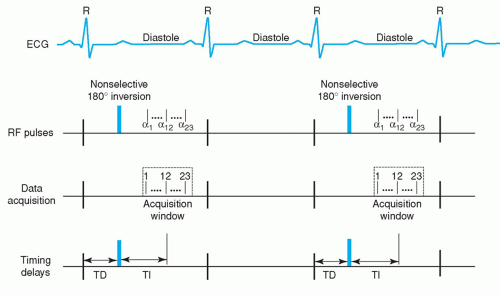
The timing diagram for the seg IR-FGE pulse sequence is shown in Figure 17.4. Immediately after the onset of the R-wave trigger, there is a delay or wait period (which is referred to as the trigger delay or TD) before a nonselec-tive 180-degree hyperbolic secant adiabatic inversion pulse is applied. Following this inversion pulse, a second variable wait period (which is referred to as the inversion time or TI) occurs, corresponding to the time between the inversion pulse and the center of the data acquisition window (for linearly ordered k-space acquisition). The data acquisition window is generally 140 to 200 milliseconds long, depending on the patient heart rate, and is placed during mid-diastole, when the heart is relatively motionless. A group of k-space lines are acquired during this acquisition window, where the flip angle used for radiofrequency excitation of each k-space line is shallow (20 to 30 degrees) to retain regional differences in magnetization that result from the inversion pulse and TI delay. The number of k-space lines in the group is limited by the repetition time (TR) between each k-space line (5 to 10 milliseconds) and the duration of mid-diastole. In the implementation shown on Figure 17.4, 23 lines of k-space are acquired during each data acquisition window, which occurs every other heartbeat. With this implementation, typically breath-hold duration of 10 to 12 cardiac cycles is required to obtain all the k-space lines for the image matrix.


IMAGING PARAMETERS

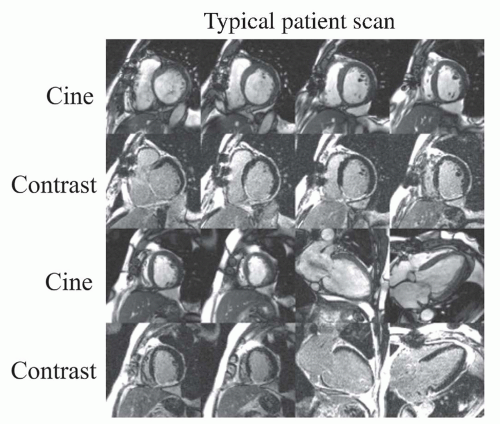
The typical settings that we use for the seg IR-FGE sequence are shown in Table 17.3. The dose of gadolinium given is usually 0.1 to 0.2 mmol/kg. Recently, the performance of DE-MRI for the detection of MI was tested in an international multicenter trial (48). In total, 282 patients with acute and 284 with chronic first AMI were scanned in 26 centers throughout the United States, Europe, and South America. The sensitivity of DE-MRI increased with increasing
gadolinium dose, reaching 99% and 94% in acute and chronic MI, respectively, with a 0.3 mmol/kg dose (Fig. 17.5). Furthermore, with a dose of 0.2 mmol/kg, if MI was identified, it was in the correct location in more than 97% of patients. Clinically, we found that using doses as low as 0.10 to 0.15 mmol/kg still provides excellent image contrast between injured and normal myocardium, and reduces the time required to wait between intravenous contrast administration and delayed enhancement imaging (49,50,51 and 52). Sufficient time is required in order to allow the blood pool signal in the LV cavity to decline and provide discernment between LV cavity and hyperenhanced myocardium.


TABLE 17.3 Typical Parameters


Parameter


Typical Values


Gadolinium dose


0.10-0.2 mmol/kg


Field of view


300-380 mm


In-plane voxel size


1.2-1.8 – 1.2-1.8 mm


Slice thickness


6-8 mma


Flip angle


20-30 degrees


Segmentsb


13-31


TI (Inversion time)


Variable


Bandwidth


90-250 Hz/pixel


TE (Echo time)


3-4 ms


TR (Repetition time)c


5-10 ms


Gating factord


2


K-space ordering


Linear


Fat saturation


No


Asymmetric echo


Yes


Gradient moment refocusinge


Yes


a Short-axis slices acquired every 10 mm to achieve identical positions as the cine images.

b Fewer segments are used for higher heart rates. See text for details.

c TR is generally defined as the time between RF pulses; however, scanner manufacturers occasionally redefine the TR to represent the time from the ECG trigger (R-wave) to the center or end of the data acquisition window (i.e., ~100 ms less than the ECG R-R interval).

d Image every other heartbeat. See text for details.

e Also known as gradient moment nulling, gradient-moment rephrasing, or flow compensation. See text for details. TI, inversion time; TE, echo time; TR, repetition time.


Adapte From Kim RJ, Shah DJ, Judd RM. How we perform delayed enhancement imaging. J Cardiovasc Magn Reson. 2003;5(3):505-514, with permission.


The field of view (FOV) in both read- and phase-encoded directions is minimized to improve spatial resolution and minimize breath-hold time without resulting in phase aliasing or “wrap” artifact in the area of interest. For patients with heart rates less than 90 beats per minute, we typically acquire 23 lines of k-space data during the middiastolic portion of the cardiac cycle. For a TR of 8 milliseconds, the data acquisition window is 184 milliseconds in duration (8 × 23 = 184). Since the middiastolic period of relative cardiac standstill is reduced in patients with faster heart rates, we decrease the number of segments (k-space lines) acquired per cardiac cycle in order to reduce the length of the imaging window. This eliminates blurring from cardiac motion during the k-space collection. In order to allow for adequate longitudinal relaxation between successive 180-degree inversion pulses, we typically image every other heartbeat (gating factor of 2). In our experience, an in-plane resolution of 1.2 to 1.8 mm by 1.2 to 1.8 mm with a slice thickness of 6 mm provides an ideal balance between adequate signal-to-noise ratio while avoiding significant partial volume effects. As stated previously, the flip angle is kept shallow to retain the effects of the inversion prepulse, but it can be relatively greater (30 degrees) if larger doses of gadolinium are given (0.2 mmol/kg) and the T1 of myocardium is correspondingly shorter.


Figure 17.5. Sensitivity of delayed enhancement magnetic resonance imaging (DE-MRI) for acute and chronic myocardial infarction (MI) is summarized according to gadoversetamide dose group and imaging time point. Numbers in parentheses are 95% confidence intervals. See text for further details. (From Kim RJ, Albert TS, Wible JH, et al. Performance of delayed-enhancement imaging with gadoversetamide contrast for the detection and assessment of myocardial infarction: An international, multicenter, double-blinded, randomized trial. Circulation. 2008:117:629-637, with permission.)

In patients who are unable to hold their breath for the duration required for the standard seg IR-FGE sequence, a number of options are available to reduce the breath-hold duration. Some simple strategies include (1) minimizing the FOV in the phase-encode direction (FOV phase); (2) imaging with only the anterior coil elements (keeping the posterior or spine coil elements turned off), allowing a smaller
FOV phase than expected without resulting in wrap-around artifact over the heart; and (3) increasing the number of k-space lines acquired per cardiac cycle (i.e., segments) with the trade-off of worse temporal resolution, or with the same temporal resolution using a steady-state free precession (SSFP) instead of FGE readout (resultant shorter echo time [TE] and TR) at the expense of a reduction in pure T1 contrast effects. In some individuals, even with the approaches outlined here, there is still inadequate breath-holding. In this situation, the use of respiratory navigators may be helpful although imaging time is prolonged. Recently a fast, “single-shot” version of DE-MRI has been developed that can acquire snap-shot images during free breathing (53). This technique uses an SSFP readout with parallel imaging acceleration and provides complete LV coverage in less than 30 seconds. This technique could be considered the preferred approach in patients more acutely ill, unable to breath-hold, or with irregular heart rhythm. However, compared with standard, segmented DE-MRI, sensitivity for detecting MI is mildly reduced, and the transmural extent of infarction (TEI) may be underestimated (53,54).


INVERSION TIME

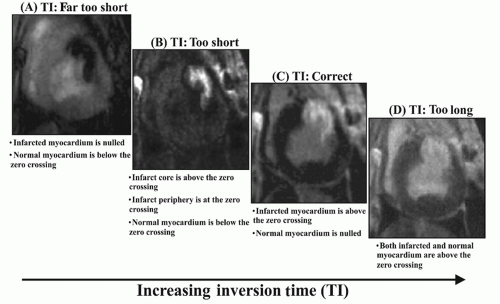
Selecting the appropriate TI is extremely important for obtaining accurate imaging results. The TI is chosen to “null” normal myocardium, the time at which the magnetization of normal myocardium reaches the zero crossing (Fig. 17.6A). It is at this point (or immediately just after) that the image intensity difference between infarcted and normal myocardium is maximized (Fig. 17.6C). If the TI is set too short, normal myocardium will be below the zero crossing and will have a negative magnetization vector at the time of k-space data acquisition. Since the image intensity corresponds to the magnitude of the magnetization vector, the image intensity of normal myocardium will increase as the TI becomes shorter and shorter, whereas the image intensity of infarcted myocardium will decrease until it reaches its own zero crossing (Fig 17.6B). At this point, infarcted myocardium will be nulled and normal myocardium will be hyperenhanced. On the opposite extreme, if the TI is set too long, the magnetization of normal myocardium will be above zero and will appear gray (not “nulled”). Although areas of infarction will have high image intensity, the relative contrast between infarcted and normal myocardium will be reduced. In principle, the optimal TI at which normal myocardium is “nulled” must be determined by imaging iteratively with different TIs. In practice, however, only one or two “test” images need to be acquired; with experience, one can estimate the optimal TI on the basis of the amount of contrast agent that is administered and the time after contrast agent administration. Figure 17.7 shows images of a patient with an anterior wall MI in whom the TI has been varied from too short to too long. Note that with the TI set moderately too short (Fig. 17.7B), the anterior wall has some regions that are hyperenhanced; however, the total extent of hyperenhancement is less than that seen when the TI is set correctly (Fig. 17.7C). This is due to the periphery of the infarcted region passing through a zero crossing, thereby affecting its apparent size (55). If the TI is set too long (Fig. 17.7D), although the contrast is reduced as
previously stated, the total extent of hyperenhancement does not change. Lastly, if the TI is set far too short (Fig. 17.7A), infarct will be “nulled” and normal myocardium will hyper-enhance. Thus, it is far better to err on the side of setting the TI too long rather than too short.
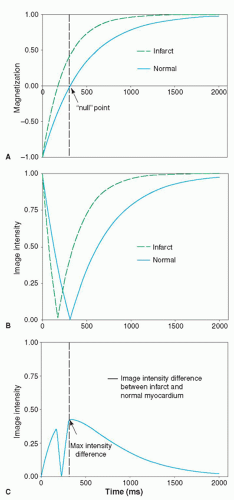


Figure 17.6. A: Inversion recovery curves of normal and infarcted myocardium assuming T1 of normal myocardium is 450 milliseconds and infarcted myocardium is 250 milliseconds. The time at which the magnetization of normal myocardium reaches the zero crossing is defined as the inversion time to “null” normal myocardium (312 milliseconds in this example). B: Image intensities resulting from an inversion prepulse with various inversion delay times. Note that image intensities correspond to the magnitude of the magnetization vector and cannot be negative. C: Difference in image intensities between infarcted and normal myocardium as a function of inversion time. The optimal inversion time is when the maximum intensity difference occurs. (From Kim RJ, Shah DJ, Judd RM. How we perform delayed enhancement imaging. J Cardiovasc Magn Reson. 2003;5(3):505-514, with permission.)


Figure 17.7. Delayed enhancement images in a subject with an anterior wall myocardial infarction in which the TI has been varied from too short to too long. See text for details. (From Kim RJ, Shah DJ, Judd RM. How we perform delayed enhancement imaging. J Cardiovasc Magn Reson. 2003;5(3):505-514, with permission.)

As stated previously, data are acquired every other heartbeat in order to allow for adequate longitudinal relaxation between successive inversion pulses. The time for recovery of 96% of the bulk magnetization is approximately four times the T1 [M(t) = M0(1 – 2e-t1/T1) or M(4T1) = M0(1 -2e-4)]. For example, if the T1 of normal myocardium after administration of gadolinium is 400 milliseconds, then in order to achieve adequate longitudinal relaxation, there should be approximately 1,600 milliseconds between successive inversion pulses or every other heartbeat imaging in patients with heart rates of 75 beats per minute (R-R interval = 800 milliseconds). In this example, the optimal TI to null normal myocardium would be approximately 280 milliseconds [TI(null) = ln(2) × T1 = 0.69 × T1]. Occasionally, imaging is performed every third heartbeat (gating factor of 3) if the patient is tachycardic. Conversely, owing to limitations in breath-hold duration and/or bradycardia, every heartbeat imaging may be performed.

Fortunately, for those that are unfamiliar with inversion recovery relaxation curves, newer pulse sequences that allow phase-sensitive reconstruction of inversion recovery data may allow a nominal TI to be used rather than a precise null time for normal myocardium (56). These techniques, by restoring signal polarity, can provide consistent contrast between infarcted and normal myocardium over a wide range of TIs and can eliminate the apparent reduction in infarct size that is seen on images acquired with TIs that are too short (56). TI “scout” sequences also have been developed to aid in selecting the correct TI (57). In our experience, these sequences only provide a reasonable “first guess” at the correct TI since they can be off by as much as 40 to 50 milliseconds. This discrepancy may be due to several reasons. For example, TI scout sequences generally do not account for the gating factor that is used in the seg IR-FGE sequence, which can lead to changes in the correct TI as described previously. In addition, recovery of longitudinal magnetization is not identical for inversion recovery prepared SSFP (often used for TI scouting) (57) and inversion recovery prepared FGE sequences (58). In our laboratory, TI scout sequences are used infrequently.


IMAGING TIME AFTER CONTRAST ADMINISTRATION

In general, once the optimal TI has been determined, it does not require adjustment if all delayed enhancement images can be acquired within approximately 5 minutes. However, it is important to keep in mind that the gadolinium concentration within normal myocardium gradually washes out
with time, and the TI will need to be adjusted upward if delayed enhancement imaging is performed over a long time span (>5 minutes). For example, Figure 17.8

Only gold members can continue reading. Log In or Register to continue

Stay updated, free articles. Join our Telegram channel

May 24, 2016 | Posted by in CARDIOLOGY | Comments Off on Assessment of Myocardial Viability by Contrast Enhancement

Full access? Get Clinical Tree

Get Clinical Tree app for offline access