Assessment of Global Ventricular Function
Nhung T. Lam
Solomon Aronson
Left ventricular systolic function is a powerful predictor of clinical outcome for a wide range of cardiovascular diseases including ischemic cardiac disease, cardiomyopathy, and valvular heart disease. Data from the CASS registry indicate that left ventricular (LV) function determined by ejection fraction is more important for predicting survival than the number of diseased vessels. Echocardiography provides both a quantitative and qualitative measure of systolic function by estimating global and regional ventricular function and by measuring ventricular volumes and ejection fraction.
EXAMINATION OF THE LEFT VENTRICLE
Echocardiography, a two-dimensional imaging technique, is used to study a three-dimensional object, the left ventricle, in real time by manipulating the transesophageal echocardiographic (TEE) probe to produce multiple imaging planes. To reproduce and compare measurements, standardized views have been developed based on internal and external references of the ventricle. The imaging planes used to describe and quantitate global left ventricular function include midesophageal four-chamber view (ME 4C) (Fig. 10.1), the midesophageal two-chamber view (ME 2C) (Fig. 10.2), midesophageal long-axis view (ME LAX) (Fig. 10.3), transgastric short-axis view (TG SAX) (Fig. 10.4), and transgastric long-axis view (TG LAX) (Fig. 10.5). During a TEE examination for global ventricular assessment, artifactual shortening of the LV long axis should be avoided or the myocardium at the mid- to apical segments will appear falsely thickened. A foreshortened left ventricle in the four-chamber view may represent a more proximal segment of the anterior wall rather than the true LV apex. The four- and two-chamber views are used to measure mitral inflow velocity, and LV volume and area as surrogates for LV preload.
To obtain the four-chamber view, the TEE probe is inserted into the midesophagus approximately 20 cm, the omniplane is rotated to 10-20 degrees, and the probe is slightly retroflexed. From the four-chamber view, the long axis of the left ventricle is centered in the middle of the sector and the image plane is slowly rotated toward 90 degrees to obtain the two-chamber view. Again, slight angulation and manipulation of the probe is necessary to obtain the two-chamber view, which includes the full length of the left ventricle and avoids foreshortening. The orthogonal axis of the two-chamber view may be used to calculate left ventricular volumes and ejection fraction. The omniplane is rotated towards 120 degrees from the two-chamber view to obtain the long-axis view. This view may be used to study the aortic valve apparatus, the left ventricle, and the LV outflow tract.
From the midesophageal level, the probe is advanced into the stomach to obtain the transgastric midpapillary short-axis view. With the omniplane at 0 degrees, the tip is anteflexed to bring the short axis into view. The short-axis midpapillary plane is preferred intraoperatively because it
provides information regarding volume, contractility, ventricular dimensions, and thickness. The short axis of the left ventricle can be imaged at many levels; however, only two imaging planes are consistently reproducible from good internal references: the transgastric midpapillary short-axis view through the body of the papillary muscles and the transgastric basal short-axis view through the mitral valve. Intraoperatively, the transgastric midpapillary view reveals changes in volume status that are reflected in the end-diastolic cavity size. Change in fractional area and fractional shortening, surrogates of ejection fraction, can be calculated with this view. Distributions of the three coronary arteries are represented in this view, making it particularly useful for monitoring new regional wall motion abnormalities.
provides information regarding volume, contractility, ventricular dimensions, and thickness. The short axis of the left ventricle can be imaged at many levels; however, only two imaging planes are consistently reproducible from good internal references: the transgastric midpapillary short-axis view through the body of the papillary muscles and the transgastric basal short-axis view through the mitral valve. Intraoperatively, the transgastric midpapillary view reveals changes in volume status that are reflected in the end-diastolic cavity size. Change in fractional area and fractional shortening, surrogates of ejection fraction, can be calculated with this view. Distributions of the three coronary arteries are represented in this view, making it particularly useful for monitoring new regional wall motion abnormalities.
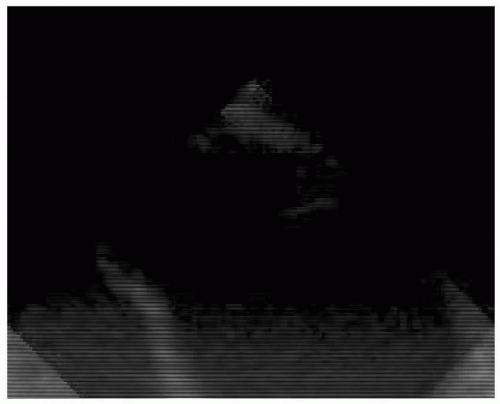 FIGURE 10.1. The midesophageal four-chamber view. |
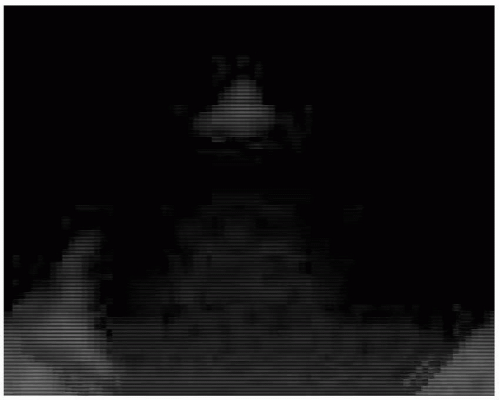 FIGURE 10.2. The midesophageal two-chamber view. |
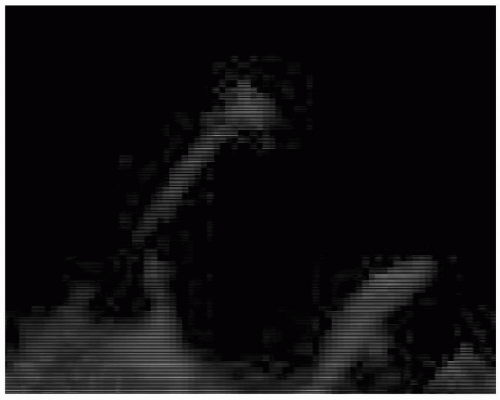 FIGURE 10.3. The midesophageal long-axis view. |
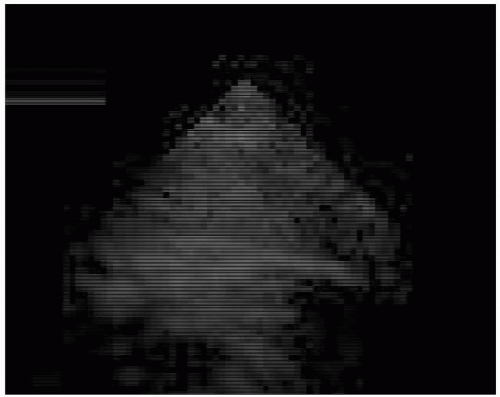 FIGURE 10.4. The transgastric short-axis view. |
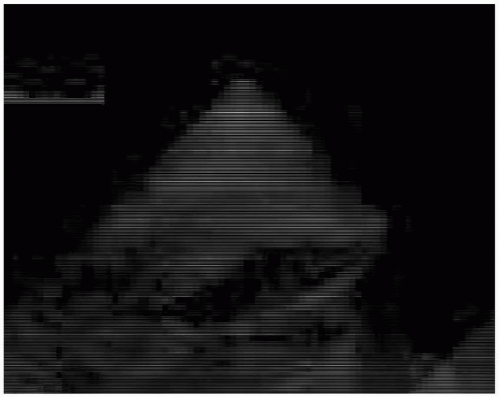 FIGURE 10.5. The transgastric long-axis view. |
To obtain the two-chamber view of the left ventricle, start at the midesophageal four-chamber view, center the left ventricle in the middle of the imaging, and rotate the omniplane out to 90 degrees. In this view, the inferior wall is at the top of the sector and the anterior wall is at the bottom, directly opposite the inferior wall.
NORMAL ANATOMY OF THE LEFT VENTRICLE
The left ventricle is a thick-walled, bullet-shaped chamber with average left ventricular wall thickness of 10.9 ± 2.0 mm and an average mass of 92 ± 16 gm/m2. In cross section, the left ventricle has a nearly circular configuration
that increases in area from base to apex. It is obliquely positioned in the chest with its apex pointing left, slightly anteriorly and inferiorly. It shares a triangular-shaped interventricular septum with the right ventricle in the anteromedial portion. The remainder of the LV wall, called the free wall, is not in contact with any other chamber.
that increases in area from base to apex. It is obliquely positioned in the chest with its apex pointing left, slightly anteriorly and inferiorly. It shares a triangular-shaped interventricular septum with the right ventricle in the anteromedial portion. The remainder of the LV wall, called the free wall, is not in contact with any other chamber.
PHASES OF VENTRICULAR SYSTOLE
In the cardiac cycle, systole starts with mitral valve closure and ends with aortic valve closure. On an electrocardiogram, onset of systole is identified at the peak of the QRS complex and end of systole after repolarization at the end of the T wave. Systole also can be determined by events in the left ventricle (Fig. 10.6). Mitral valve closure marks the beginning of systole and is followed by an isovolumic contraction period. During this period, ventricular pressure rises rapidly while volume stays constant. As ventricular pressure exceeds aortic pressure, the aortic valve opens. The ejection phase follows, marked by acceleration and deceleration. During the first half of the ejection phase when LV pressure exceeds aortic pressure, blood rushes from the left ventricle into the aorta. Then in the deceleration phase of systole when aortic pressure exceeds ventricular pressure the forward flow of blood at a progressively slower velocity is reflected by the downward slope of the velocity tracing.
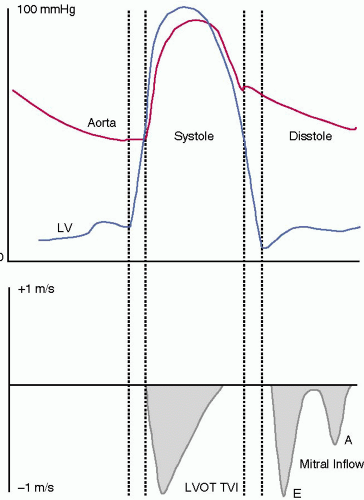 FIGURE 10.6. The ventricular cycle and the corresponding Doppler flow velocity profiles in the LV outflow tract and the mitral inflow tract. |
LEFT VENTRICULAR SYSTOLIC FUNCTION
Ventricular systolic function is described by both load-independent and load-dependent indices of myocardial performance. They vary depending on preload and afterload. Therefore, estimates of contractility require measurement of ventricular ejection performance during different loading conditions. The clinical evaluation of ventricular function often relies on evaluating preload, afterload, cardiac output, ejection fraction, end-systolic volumes, and dimensions. Echocardiographic modalities designed for evaluating contractility independent of load include pressure-area relationships.
EJECTION PHASE INDICES OF LEFT VENTRICULAR PERFORMANCE
LV global systolic performance is commonly expressed in terms of cardiac output, ejection fraction, and fractional shortening. The rate of ejection can be measured by quantifying the peak and mean velocity of fiber shortening. These indices are very sensitive to changes in preload and afterload.
CARDIAC OUTPUT
Cardiac output is calculated from the equation CO = SV × HR, where SV is stroke volume and HR is heart rate. Stroke volume is defined as the difference between the end-diastolic and end-systolic volume in the left ventricle. Since volume is a three-dimensional parameter, calculation of stroke volume with two-dimensional echo requires measuring a cross-sectional area and the flow through that area with Doppler flow measurement using the equation below:
SV = CSA × VTI
where SV is stroke volume, CSA is the cross-sectional area, and VTI is the velocity time integral.
During systole, the left ventricle ejects a given amount of blood (SV) into the cylindrically shaped aorta, which occupies a set volume in the aorta. Stroke volume is calculated by measuring the area and height of this blood column in the aorta. The cross-sectional area at the base
of this column is derived by measuring the diameter (D) of the base of the aorta and applying the formula for the area of a circle: πr2 or π(D/2)2. The height of the column is obtained with Doppler to measure the flow through the aorta during systole. The area under the Doppler systolic flow velocity curve or the velocity time integral (VTI) represents the height of the cylinder. Thus the volume of the cylinder or stroke volume is the product of the CSA and VTI (Fig. 10.7).
of this column is derived by measuring the diameter (D) of the base of the aorta and applying the formula for the area of a circle: πr2 or π(D/2)2. The height of the column is obtained with Doppler to measure the flow through the aorta during systole. The area under the Doppler systolic flow velocity curve or the velocity time integral (VTI) represents the height of the cylinder. Thus the volume of the cylinder or stroke volume is the product of the CSA and VTI (Fig. 10.7).
Using this method to derive volume from area and flow measurements, we make several assumptions. First, the area measured for the calculation of stroke volume is constant during the entire period of systole. Second, a small error in diameter measurement quadruples the error in the calculation for the cross-sectional area. Third, flow across the area of interest is assumed to be laminar, such that the recorded flow represents the average flow and distance of flow in that region. In the presence of aortic valve disease, stroke volume measurement in the ascending aorta will be inaccurate because flow distal to the valve is not laminar. Fourth, the Doppler beam angle of incidence is assumed to be parallel to the direction of blood flow in that area. Finally, the area and flow measurements must be made at the same anatomic site.
Several investigators have looked into the optimal site for measurements of the Doppler flow velocity. Muhiudeen and colleagues (2) look at the pulmonary artery as a site for cardiac output measurement. They measured the cross-sectional area and pulsed-wave Doppler signal of the pulmonary artery systolic flow. The result correlated modestly with cardiac output measured by the thermodilution method (r = 0.65). Pulmonary systolic flow detected only intraoperative increases in cardiac output greater than 15% (sensitivity, 71%; specificity, 82%), not decreases (sensitivity, 54%; specificity, 90%). Darmon and colleagues (3) used the transgastric long-axis view to obtain a spectral envelope with the continuous wave beam placed in the path from the LV outflow tract to the ascending aorta. The angle between the Doppler beam and the aortic valve plane was 7 ± 5 degrees with a range of 0 to 18 degrees. For the cross-sectional area, they used the time-averaged shape of the aortic valve aperture, measured in the upper esophageal view at 30 degrees. They obtained the TEE frame where the aortic valve cusp tips were as close to a straight triangle as possible, thus equating this structure to an equilateral triangle. The length of each side of the aortic valve was measured and the three values were averaged before calculation of the area of the aortic valve orifice in systole.
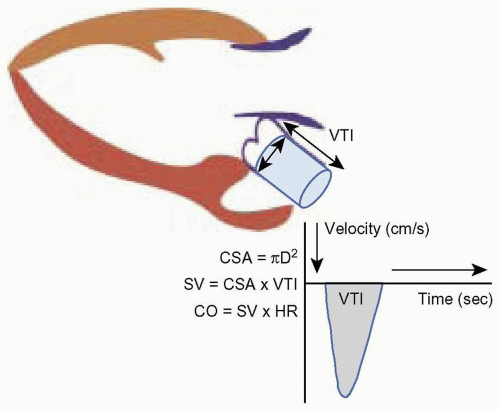 FIGURE 10.7. Stroke volume calculation. |
AVA = 0.5 × Cos 30° × S2
AVA = 0.433 × S2
When the triangular model was used to calculate aortic valve area, Doppler-derived cardiac output (DCO) correlated tightly with thermodilution results for cardiac output (TCO) (r = 0.93) (Fig. 10.8).
This same group also substantiated the circular model to describe the aortic valve based on the observation that at maximal valve aperture, near peak systole, the aortic valve orifice appears nearly circular (Fig. 10.9). The aortic valve diameter (D) was measured in the longitudinal view, at the hinge points using the inner leaflet surface to inner leaflet surface method (Fig. 10.10). The aortic valve orifice area was then calculated using the equation:
AVA = π × (D/2)2
 FIGURE 10.8. The upper esophageal aortic valve short-axis view demonstrating the aortic valve resembling the shape of an equilateral triangle. |
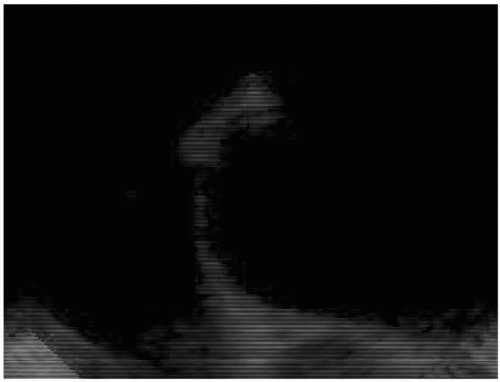 FIGURE 10.9. The upper esophageal aortic valve short-axis view demonstrating the aortic valve near peak systole resembling the shape of a circle. |
The transgastric long-axis view was used to obtain the Doppler spectral envelope with the continuous wave beam placed in the path from the LV outflow tract to the ascending aorta. CO based on this circular model has a correlation coefficient of 0.88 when compared to the thermodilution method (3).
Perrino and colleagues (4) used the triangular aortic valve method to calculate cardiac output with high reproducibility. In 32 of 33 patients (97%), they were able to image the LV outflow tract in the transgastric long-axis view and calculate cardiac output with a correlation of r = 0.98 for intrasubject changes in cardiac output. Serial changes in cardiac output >1 L/min were tracked correctly in 97% of the cases. The magnitude of change in cardiac output was underestimated by 14% with Doppler-derived cardiac output when compared to the thermodilution method (4). Thus Doppler-derived cardiac output predicted the direction of change with high correlation; in a dynamic setting, it can underestimate the magnitude of the change.
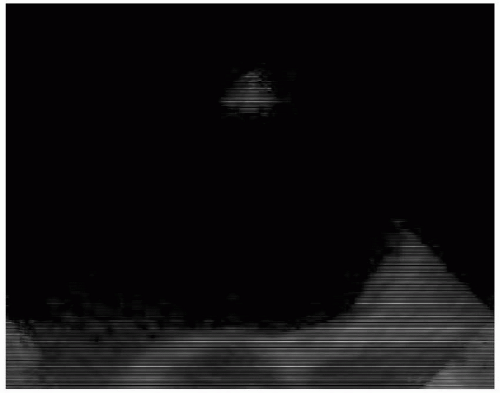 FIGURE 10.10. The midesophageal long-axis view demonstrating the aortic valve diameter (D) at the hinge points using the inner leaflet surface to inner leaflet surface method. |
EJECTION FRACTION
Ejection fraction is calculated by the following formula:
EF% = (EDV − ESV/EDV) × 100%
where EDV, volume at end-diastole; ESV, volume at end systole. The American Society of Echocardiography recommends using the modified Simpson’s method to derive the ventricular volumes. (See the section on Preload later in the chapter.) The limitations of the method must be recognized, however. First, endocardial definition is affected by the physic of ultrasound and by anatomic limitations. For example, the lateral wall in the midesophageal four-chamber view is often difficult to visualize and trace because of the anatomic position of the endocardial-ventricular interface in this imaging plane. The border is parallel to the echo beam and therefore appears “blurred” as a result of poor lateral resolution. Signal attenuation by calcium deposits on the mitral annulus can create “drop out” of the echo signal distal to the deposits further complicating endocardial detection of the ventricular walls. The numerous trabeculations in the left ventricle, most notably its apex, may sometimes be falsely identified as the endocardial border. Therefore the endocardium identified by echocardiography is often different than the endocardium identified by angiography, in which the contrast material fills the trabeculations and distinguishes them from the true endocardium. With ultrasound contrast, the true endocardial border is easily revealed.
FRACTIONAL AREA CHANGE
Because of the limitations to accurate endocardial detection and the time-consuming nature of calculating volumes, echocardiographers often rely on measuring the fractional area change (FAC) intraoperatively based on the area measured in the transgastric midpapillary view. The equation is as follows:

where FAC is the fractional area change, LVEDA is the area at end-diastole; LVESA is the area at end-systole.
This method measures the percent of change in myocardial dimension as an estimate of LV contractile performance. This index of systolic performance is heavily afterload dependent and slightly preload dependent. Intraoperatively FAC is routinely used as a surrogate for ejection fraction. Several studies with intraoperative TEE using the midpapillary short-axis view to calculate ejection fraction have demonstrated a close correlation between ejection fraction based on fractional area change and radionuclide angiography and scintigraphy (r = 0.96 and r = 0.82, respectively) (Fig. 10.11) (5,6).
This method measures the percent of change in myocardial dimension as an estimate of LV contractile performance. This index of systolic performance is heavily afterload dependent and slightly preload dependent. Intraoperatively FAC is routinely used as a surrogate for ejection fraction. Several studies with intraoperative TEE using the midpapillary short-axis view to calculate ejection fraction have demonstrated a close correlation between ejection fraction based on fractional area change and radionuclide angiography and scintigraphy (r = 0.96 and r = 0.82, respectively) (Fig. 10.11) (5,6).
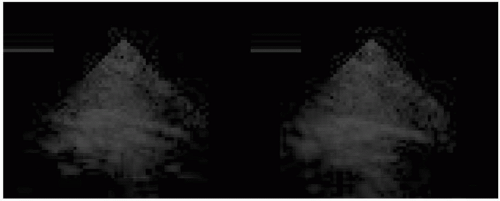 FIGURE 10.11. The midpapillary view of the left ventricle at end-diastole (A) and end-systole (B). |
SYSTOLIC INDEX OF CONTRACTILITY (dP/dt)
Although ejection phase indices of LV performance are easy to obtain, their load dependency may confound the accurate assessment of LV systolic function. The maximal rate of pressure increase during the isovolumic phase of ventricular systole dP/dt(max) is sensitive to changes in contractility, insensitive to changes in afterload and wall motion abnormalities, and only mildly affected by changes in preload. Continuous wave Doppler is used to determine the velocity of the mitral regurgitation jet. From that the rate of pressure increase or dP/dt(mean) is determined (7). This method requires that one has a mitral regurgitant jet. Since the method gives the mean dP/dt, the value often underestimates the peak dP/dt. To obtain the dP/dt, the continuous wave velocity profile of the mitral regurgitant jet is optimized. Then the time it takes for the mitral regurgitant velocity to rise from 1 cm/s to 2 cm/s is measured. Using the simplified Bernoulli equation, the velocities are converted into pressures.
P = 4V2 = 4(1)2 = 4mm Hg
P = 4V2 = 4(3)2 = 36 mm Hg
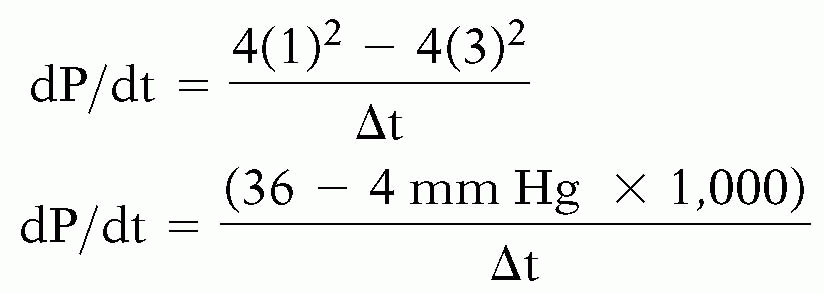
A dP/dt value > 1200 mm Hg/sec or a time of ≤ 27 msec is considered normal and dP/dt value < 1000 mmHg/sec or a time of ≥ 32 msec is considered abnormal. In one study, dP/dt and −dP/dt indices were determined prospectively in 56 patients with chronic congestive heart failure and low ejection fraction < 50% to predict eventfree survival (8).
Unlike ejection phase indices described above, pressure volume relationships describe the contractile state of the myocardium. The slope of the pressure volume loops or the end-systolic elastance is a load-independent indicator of preload-recruitable stroke work and therefore reflects true contractility. Until recently, pressure volume analysis has been difficult to obtain on-line. With the advent of echocardiographic automated border detection, continuous measurement of the LV area as a surrogate for LV volume is possible. Gorcscan and colleagues (9) coupled continuous area measurements obtained with TEE with continuous pressure data measured at the level of the left ventricle in 13 patients undergoing coronary artery bypass grafts. When area was substituted for volume, stroke force from pressure area loops was closely correlated with changes in estimates of stroke work from pressure volume loops for individual patients before bypass (mean correlation r = .99 ± .03) and after bypass (mean correlation r = .96 ± .05). Pressure estimates of end-systolic elastance, maximal elastance, and preload-recruitable
stroke force decreased from before to after cardiopulmonary bypass. The load-dependent measures of LV function such as stroke volume, cardiac output, and fractional area change were unchanged after surgery in these patients (Figs. 10.12, 10.13 and 10.14).
stroke force decreased from before to after cardiopulmonary bypass. The load-dependent measures of LV function such as stroke volume, cardiac output, and fractional area change were unchanged after surgery in these patients (Figs. 10.12, 10.13 and 10.14).
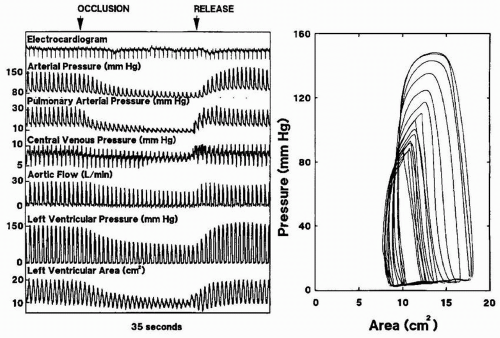 FIGURE 10.12. Traces of simultaneous waveform and pressure-area loop data from a patient during an inferior vena caval occlusion maneuver. From: Gorcsan J 3rd, Gasior TA, Mandarino WA, Deneault LG, Hattler BG, Pinsky MR. Assessment of the immediate effects of cardiopulmonary bypass on left ventricular performance by on-line pressure-area relations. Circulation 1994;89(1):180-90. |
Although contractility independent of different LV loading conditions can be measured using two-dimensional TEE, this method has not been widely adopted because it is cumbersome. Tissue Doppler imaging, a relatively recent addition to the diagnostic imaging modalities available with echocardiography, provides quantitative measurement of global as well as segmental LV function. Tissue Doppler technology is based on the same principles as color flow Doppler mapping.
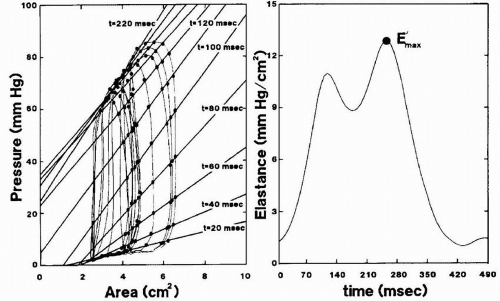 FIGURE 10.13. Plots show determination of time-varying elastance from pressure-area loops during inferior vena caval occlusion. Left panel shows elastance plots every 20 milliseconds from the onset of systole; right panel, corresponding elastance values with maximal elastance (E′max). From Gorcsan J 3rd, Gasior TA, Mandarino WA, Deneault LG, Hattler BG, Pinsky MR. Assessment of the immediate effects of cardiopulmonary bypass on left ventricular performance by on-line pressure-area relations. Circulation 1994;89(1):180-90.
Stay updated, free articles. Join our Telegram channel
Full access? Get Clinical Tree
 Get Clinical Tree app for offline access

|