Assessment for Noncardiac Surgery
Albert C. Perrino Jr.
Scott T. Reeves
The introduction of commercial TEE systems in the mid-1980s was greeted with considerable enthusiasm by cardiac anesthesiologists recognizing the potential this technology offered to better monitor and diagnose patients undergoing coronary artery bypass and valve surgeries. As cardiac surgery remained the focus of intraoperative TEE, there was a strong undercurrent to explore its applications in noncardiac procedures. Limited availability of echocardiographic systems and clinicians trained in TEE initially slowed the growth of TEE in noncardiac procedures. However, as these limitations abated new applications for TEE emerged in each corridor of the OR. As will be presented in this chapter, the breadth of TEE use in current surgical practice is remarkable. Its use specific to vascular, general, orthopedic, and liver transplantation surgeries will receive detailed attention. Moreover, the ability of TEE to provide a rapid diagnosis in a patient not responding to standard therapies is a universal application warranting TEE availability to most anesthetized patients. Accordingly, the TEE evaluation for the hemodynamically unstable patient is presented independent of surgical procedure.
INDICATIONS
In common with other intraoperative monitoring devices, the indications for TEE remain only partially defined. Clarifying the indications for TEE is not a trivial concern given the expense incurred and trained personnel required to perform an intraoperative TEE examination (1,2). Unfortunately, well-conducted outcome trials examining the effectiveness of TEE during noncardiac surgery are lacking and unlikely to be forthcoming. Several parties have attempted to provide guidance in this gray area. Most notable among these are the 1996 practice guidelines published from a consensus conference of the American Society of Anesthesiologists and the Society of Cardiovascular Anesthesiologists Task Force on TEE (3). Their recommendations are divided into three categories based on the strength of supporting evidence and/or expert opinion that TEE improves clinical outcomes. Category I indications are supported by the strongest evidence or expert opinion; TEE frequently is useful in improving clinical outcomes in these settings and often is indicated. Category II indications are supported by weaker evidence and expert consensus; TEE may be useful in improving clinical outcomes in these settings but appropriate indications are less certain. Category III indications have little scientific or expert support and appropriate indications are uncertain. As is true for each of these categories but particularly germane for Category III, the lack of supporting evidence is often owing to the absence of relevant studies rather than to existing evidence of ineffectiveness. Unfortunately, yet appropriately given the paucity and expense of outcome trials, these guidelines are based largely on opinion and mostly refer to the care of cardiac surgical patients. Subsequent clinical trials and technological advances will undoubtedly lead to changes in the indications for intraoperative TEE.
Although most relevant to cardiac surgery, the ASA/SCA practice guidelines have important implications to noncardiac surgery as well. Without controversy is the Category I indication for intraoperative evaluation of acute persistent and life-threatening hemodynamic disturbances in which ventricular function and its determinants are uncertain and have not responded to treatment. This is the all too common scenario of employing TEE as a rescue diagnostic tool. Its sister Category II indication is for perioperative use in patients with increased risk of hemodynamic disturbances. Here, TEE is recommended as a preemptive monitoring tool to avoid life-threatening disturbances and to optimize organ perfusion. Together, these indications remain, by far, the most frequent reasons for the use of intraoperative TEE during noncardiac surgery. Although the task force notes that direct evidence was lacking to support these indications, expert opinion agreed that TEE was of clear benefit to diagnose the hemodynamic
problem and to suggest appropriate therapy. This opinion has been confirmed by a series of clinical trials conducted subsequent to the Task Force deliberations and provides direct evidence for an expanded use of TEE monitoring during noncardiac surgery.
problem and to suggest appropriate therapy. This opinion has been confirmed by a series of clinical trials conducted subsequent to the Task Force deliberations and provides direct evidence for an expanded use of TEE monitoring during noncardiac surgery.
To investigate the use and impact of transesophageal echocardiography, Suriani et al. from Mount Sinai Medical Center, reviewed 123 TEE examinations performed during noncardiac surgery (4). The exams were classified as consultative when performed by a consultant (55 points) and nonconsultative (68 points) when performed by the attending anesthesiologist. The impact of TEE was rated as major if TEE was used to treat a life-threatening event, it changed surgical and/or anesthetic management, or led to further evaluation in the postoperative period. Lesser impacts were rated as minor or limited. They judged TEE as having an impact on care in 81% of the patients, and in 15% the impact was major. Their elderly ASA 3 and 4 patients particularly benefited from TEE during noncardiac surgery. This study confirmed that TEE in patients undergoing noncardiac surgery is efficacious in rapidly disclosing new findings and information during periods of hemodynamic instability.
Kolev and colleagues (5) further studied the current role played by intraoperative TEE and examined the impact of the ASA/SCA category-based TEE indications. The study included 224 patients from seven western European countries. In this group of patients who also were monitored with radial and pulmonary arterial catheters, TEE was the most important guiding factor in 25% of interventions. Not surprisingly, TEE use for Category I indications were associated with the most frequent changes in management. Noteworthy is that these practitioners used TEE most frequently for Category II indications, suggesting the growing acceptance of TEE as a monitor of cardiovascular function. Schmidlin examined the use of TEE at the University Hospital in Zurich, Switzerland, and found that in 123 vascular surgery cases TEE led to changes in drug or fluid therapy in 32% of patients and a new diagnosis in 9% (6).
The impact of TEE on noncardiac surgery has also been widely examined in Canadian practice (7,8,9,10). Denault from the Notre Dame Hospital in Montreal examined the records of 214 patients. The indications for TEE slightly favored Category I (37%) versus Categories II (31%) and III (27%) (9). They noted that TEE led to a change in management, either surgical or medical, in 40% of patients. The modifications in case management, in order of frequency, were
1. Change in medical therapy
2. Confirming or invalidating a diagnosis
3. Unplanned surgical reinterventions
4. Substitute for pulmonary artery catheter
5. Positioning of intravascular devices
They concurred with the findings of prior studies regarding the value of TEE in Category I patients, but also demonstrated substantial impact of TEE in Categories II and III patients in the perioperative period. Remarkably, the authors concluded that the impact of TEE in the noncardiac setting was even more important than that they had observed in cardiac surgery.
These observational studies provide strong support for the value of TEE in noncardiac surgeries and suggest outcome trials to further clarify its role and indications. Two recent outcome studies, first by Sinclair (11) and subsequently by TJ Gan and colleagues (12), have demonstrated that goal-directed fluid management guided by echocardiography improves outcomes in a cohort of patients undergoing a variety of noncardiac procedures. These results give objective support to the many case reports and observational studies of the value of echocardiography as a monitor of fluid management and cardiovascular performance (13). In the authors’ opinion the body of evidence for its application in this regard now warrants this indication as a promotion to Category I status.
In summary, these data on noncardiac surgery patients show TEE’s value both as a diagnostic tool and as an intraoperative monitor over and above that achievable with radial and pulmonary arterial catheters. This data is not dissimilar to that observed in the ICU setting where at least one-third of noncardiac surgery ICU patients’ care is altered by TEE examination independent of the presence of a pulmonary arterial catheter (14,15). While much of the early attention on TEE was focused on its ability to detect myocardial ischemia (16,17,18) the above studies reveal that in current practice TEE’s add-on value exists in its ability to monitor fluid status and global ventricular function.
APPROACH
Optimization of Ventricular Performance during Noncardiac Surgery
The principles underlying optimization of ventricular performance using TEE remain guided by the Frank-Starling relationship (19,20). Figure 38.1 demonstrates the classical Frank-Starling curvilinear relationship, showing that increases in left ventricular end-diastolic volume (LVEDV) result in a progressively greater stroke volume. An increase in contractility, such as that which occurs with the addition of an inotrope, will shift the curve upwards, resulting in increasing stroke volume for any given LVEDV. Increases in afterload on the other hand have an inverse relationship to stroke volume as depicted in Figure 38.1.
The remarkable longevity of this approach stems from its ability to incorporate both diastolic (e.g., preload) and systolic functions. As these functions are co-dependent, it
is unsatisfactory to attempt to understand the state of cardiac functioning by an independent examination of these factors. For example, although the left ventricular end-diastolic area (LVEDA) has many advantages in assessing preload compared to PA pressures, in itself it is of limited value (21). An intraoperative LVEDA of 12 cm2 is no more sufficient to determine that fluid status is “normal” or ideal than knowing that the PADP is 10 mm HG. The broad diversity in cardiac function and pathology, as well as the effects of surgery and anesthetics, preclude such assessments in the OR. Consequently, the value of the Frank-Starling relationship is that it provides an iterative approach to optimizing the relationship between preload and systolic output for the particular case at hand. The necessary parameters for deriving the Frank-Starling relationship, preload and stroke volume, are easily monitored intraoperatively with TEE.
is unsatisfactory to attempt to understand the state of cardiac functioning by an independent examination of these factors. For example, although the left ventricular end-diastolic area (LVEDA) has many advantages in assessing preload compared to PA pressures, in itself it is of limited value (21). An intraoperative LVEDA of 12 cm2 is no more sufficient to determine that fluid status is “normal” or ideal than knowing that the PADP is 10 mm HG. The broad diversity in cardiac function and pathology, as well as the effects of surgery and anesthetics, preclude such assessments in the OR. Consequently, the value of the Frank-Starling relationship is that it provides an iterative approach to optimizing the relationship between preload and systolic output for the particular case at hand. The necessary parameters for deriving the Frank-Starling relationship, preload and stroke volume, are easily monitored intraoperatively with TEE.
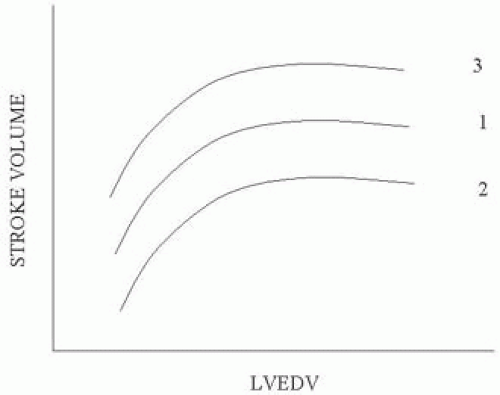 FIGURE 38.1. Frank-Starling Relationship: Demonstrates the effect of increasing left ventricular end-diastolic volume (LVEDV), i.e., (1) preload on resulting stroke volume in the normal heart, (2) failing heart, and (3) heart exposed to an inotrope. |
Assessing Preload
As a measure of preload, TEE is superb for both quantitative assessment and monitoring the adequacy of preload throughout surgery (22,23,24,25,26). By far the most popular approach to measure LV preload is by determination of the LVEDA from the TG midpapillary SAX view. Although LVEDV is considered the ideal measurement, the time-consuming imaging and calculations required make LVEDV currently an unacceptable measurement for intraoperative use. The LVEDA has been validated to accurately track changes in intraoperative fluid status and is simply calculated from manual tracings of still frame echoes at end-diastole or from the output of an automated border detection system such as Acoustic Quantification (27). The border detection algorithm provides beat-to-beat quantitative measures of LV end-diastolic and end-systolic areas as well as the ejection fraction (Figs. 38.2 and 38.3). This system is particularly well suited for noncardiac surgery because there is little interference from the surgical procedure. In contrast, the surgical exposure and cardiac manipulations that occur in
open chest procedures often produce repeated disruptions in border detection limiting the use of acoustic quantification for cardiac surgery.
open chest procedures often produce repeated disruptions in border detection limiting the use of acoustic quantification for cardiac surgery.
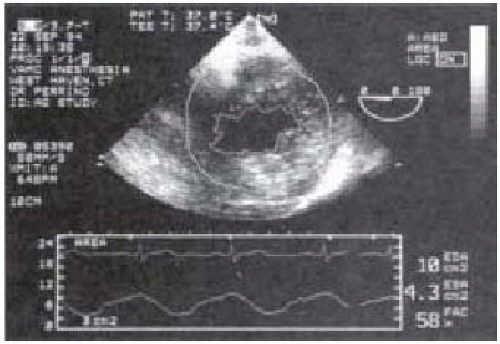 FIGURE 38.2. Automated Border Detection has identified the endocardial-blood interface (inner tracing) in this TG SAX view and provides continuous digital waveform display of LV cavity areas and calculation of LV end-diastolic area (EDA), end systolic area (ESA), and fractional area change (FAC). From Perrino et al. Anesthesiology Vol 83, No. 2, August 1995. |
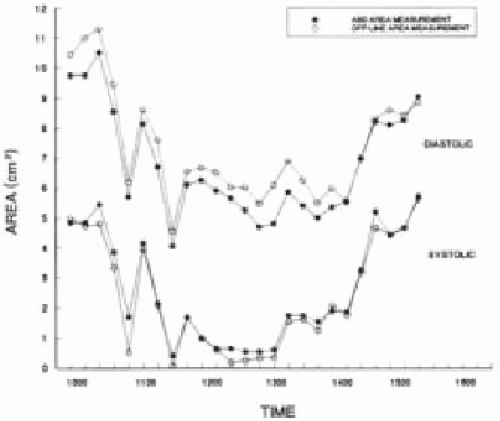 FIGURE 38.3. Changes in left ventricular end-diastolic area and end-systolic area by automated border detection and by offline echocardiographer review in a patient who underwent repair of a hip fracture. Automated measurements accurately tracked the loss in preload secondary to hemorrhage and its recovery following resuscitative therapy. From Perrino et al. Anesthesiology Vol 83, No. 2, August 1995. |
Normal values for LVEDA are typically 12-18 cm2; however preexisting cardiac disease, acute alterations in ventricular compliance, and increased metabolic demands alter the pressure-volume relationship of the ventricle and often the optimal intraoperative LVEDA will exceed normal. For these reasons, we strongly advise against using a single parameter, in this case LVEDA, in isolation as the basis for clinical fluid management. Rather, by using LVEDA measures of preload combined with matched Doppler measurements of stroke volume, the clinician can derive an intraoperative Starling curve for the patient and effectively titrate fluid, inotropic, and vasoactive therapy to optimize cardiovascular status.
Assessing Stroke Volume
Due to the challenges in obtaining LV volumes with 2-D echoes, Doppler techniques are preferred for stroke volume determination. In using the Doppler approach, it is important not to confuse blood flow velocity, which is the speed at which blood travels and expressed as cm/sec, with stroke volume, which is the amount of blood that travels in a single cycle, expressed as cm3/cycle. Stroke volume (SV) is calculated as the time velocity integral (TVI) multiplied by the cross-sectional area (CSA) of the conduit:
SV = TVI × CSA
To perform an echocardiographic determination of volumetric flow, a Doppler measurement of the instantaneous blood-flow velocities and a 2-D measurement of cross- sectional area are obtained (Fig. 38.4). The instantaneous velocities during systole are traced from the spectral display and the echocardiographic system’s internal software package calculates the time velocity integral (TVI cm) (Fig. 38.5). Conceptually, the time velocity integral represents the cumulative distance, commonly referred to as the stroke distance, that the red cells traveled during the systolic ejection phase. By multiplying the stroke distance by the CSA (cm2) of the conduit (e.g., aorta, mitral valve, or pulmonary artery) through which the blood traveled, the stroke volume (cm3) is obtained (28,29,30,31,32,33,34). Cardiac output, which expresses volumetric flow in cm3/min, is determined from the product of SV and heart rate.
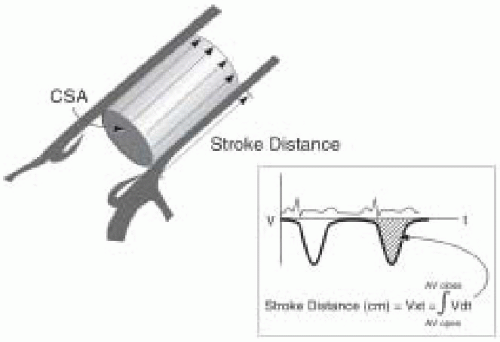 FIGURE 38.4. Stroke volume determination. Volumetric flow can be determined from a combination of area and velocity measurements. From Perrino, Reeves eds., A Practical Approach to TEE, Lippincott, 2002. |
Echocardiographic Techniques for Stroke Volume Measurement (Table 38.1)
SV and CO measurements using TEE are best measured at the left ventricular outflow tract or at the aortic valve (31,33,34). Multiplane TEE offers excellent windows at these sites for both Doppler blood flow measurements and 2-D echocardiographic measurements of CSA. Several clinical studies have confirmed that the CO measurements obtained by TEE compare favorably to those obtained by thermodilution (33,34).
LVOT or transaortic valvular flows are most reliably obtained from the TG LAX and the deep TG LAX views, as blood flow will be near parallel to the ultrasound beam (Fig. 38.5). It is critical to carefully interrogate blood flow through minor alterations in probe position and multiplane angle to obtain the optimal Doppler spectral signal. The maximal velocity profile associated with a dense spectral signal is sought.
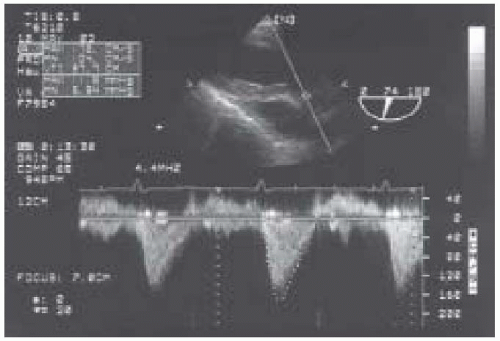 FIGURE 38.5. TG Long-axis view is displayed with CW Doppler directed through aortic valve orifice. The outer envelope of the spectral signal is traced, providing a stroke distance calculation. Heart rate is 94/min. Stroke volume = 2.5 cm2 × 27.7 cm = 69.2 cc. Cardiac output = 69.2 cc × 94/min = 6505 cc/min. From Perrino, Reeves eds. Practical Approach to TEE, Lippincott, 2002. |
TABLE 38.1. TEE Measurements of Stroke Volume | ||||||||||||||||||||
|---|---|---|---|---|---|---|---|---|---|---|---|---|---|---|---|---|---|---|---|---|
|
The CSA of the LVOT is best obtained from the ME LAX view. The CSA is calculated from a measurement of the LVOT diameter as: CSAlvot = π(diameter/2)2. For transaortic valve stroke volume calculation, the CSA of the aortic valve is approximated by planimetry of the equilateral triangle-shaped orifice observed in midsystole (33). The aortic valve is viewed in cross section from the ME AV SAX window, and frame-by-frame review is used to capture the valve in midsytole.
Right Heart Stroke Volume Calculation (Table 38.1)
Alternatively right-sided flows and diameters can be analyzed from the main pulmonary artery (MPA) or the mitral valve (MV). PW or CW Doppler analysis proceeds after the main pulmonary artery is imaged from the UE aortic arch SAX view or from the right ventricular outflow tract imaged from transgastric windows at 110-150 degree rotation of the transducer and rightward turn of the TEE probe (Fig. 38.6). In all cases the maximal velocity profile is sought. Measurement of flow across the mitral valve is accomplished by placing the sample volume at the level of the mitral annulus to obtain the transmitral time velocity integral, which is then multiplied by the mitral valve annulus. Compared to measures from the LVOT or ascending aorta, the diameters of the MPA and MV have greater fluctuation during the cardiac cycle (31) and these measurements are less reliable compared to those from the LVOT and aortic valve (35). In addition, the mitral valve orifice is not circular and its size changes during diastole.
Generation of the Frank-Starling Curve: Boluses of IV fluids are administered until a satisfactory end point is achieved (e.g., stroke volume does not increase by 10% with a 3 cc/kg fluid bolus) while avoiding distension of the left ventricle. Great care must be utilized when volume challenging a depressed ventricle. Also, it must be remembered that the right ventricle may become distended prior to achieving the desired end point and without left ventricular distension (36).
Alternative Approaches to Optimizing Fluid Status
Many echocardiographers prefer to use visual estimates of LVEDA to monitor preload with TEE rather than more quantitative approaches (26,38). Reich et al. demonstrated that experienced echocardiographers are able to detect reductions in blood volume from cine-loop video recordings with high sensitivity (80-95%) and specificity (80%). The accuracy of real-time visual estimates of LV dimensions has more recently been challenged (38). We recommend the use of quad screen review to assist these qualitative assessments. Having a baseline TG mid-SAX view displayed improves comparative judgments of fluid status and ventricular performance during the course of surgery (39) (Fig. 38.7).
Another useful echocardiographic marker for inadequate preload is cavity obliteration in the end-systolic frame (Fig. 38.8). Commonly referred to as “kissing papillaries,” this finding is suggestive of hypovolemia but is not specific as decreases in vascular resistance and increases in inotropy also affect end-systolic volumes (40,41). When
systolic cavity obliteration is observed, additional data from diastolic views and hemodynamic calculations are necessary to complete the diagnosis.
systolic cavity obliteration is observed, additional data from diastolic views and hemodynamic calculations are necessary to complete the diagnosis.
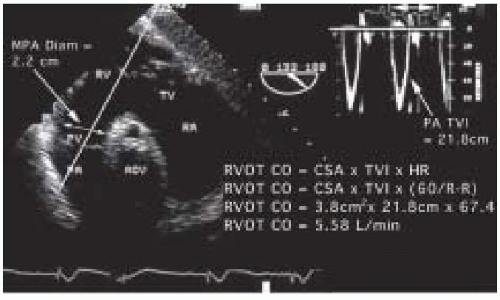 FIGURE 38.6. Calculation of Cardiac Output: Right Ventricular Outflow Tract Approach. Left: TG right ventricular inflow/outflow view. The Doppler beam is aligned as close to parallel with blood flow through the RVOT and the diameter is measured at the site where the pulse wave sample volume is placed. In this case, the MPA diam = 2.2 cm. Right: Using pulsed wave Doppler, the RVOT time velocity integral is obtained and the (D/2)2 formula calculates a cross-sectional area of 3.8 cm2. When multiplied by the TVI and the heart rate, CO is calculated to be 5.58 L/min. RVOT, right ventricular outflow tract; PA, pulmonary artery; RV, right ventricle; TV, tricuspid valve; RA, right atrium; PV, pulmonic valve; Aov, aortic valve; CO, cardiac output; Diam, diameter; TVI, time velocity integral; R-R, time interval between two ‘R’ on the electrocardiogram; cm, centimeter. From Perrino, Reeves eds. Practical Approach to TEE, Lippincott, 2002. |
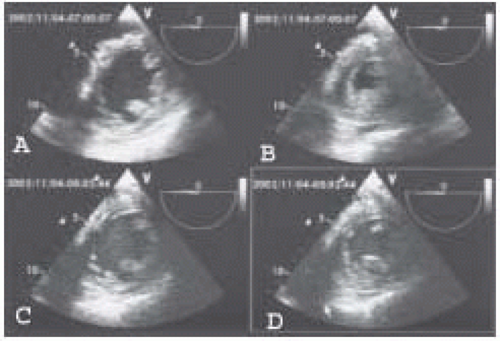 FIGURE 38.7. Quad screen display of LV end-diastolic frames (left) and end-systolic frames (right) in a patient undergoing abdominal aortic aneurysm resection. The top pair show LV dimensions prior to placement of the aortic cross clamp and the bottom pair are images taken during aortic cross clamping. The significant increase in LV end-systolic area during cross clamping is easily appreciated.
Stay updated, free articles. Join our Telegram channel
Full access? Get Clinical Tree
 Get Clinical Tree app for offline access

|