Fig. 20.1
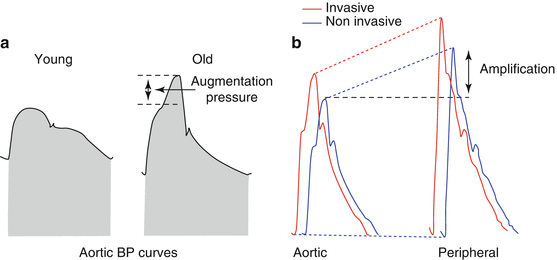
Blood pressure curve in the ascending aorta with its forward and backward components. Augmentation pressure is the difference between systolic blood pressure and the peak of the forward wave and represents the additional systolic blood pressure increase in the ascending aorta due to wave reflections

Fig. 20.2
(a) Physiological aspects of pulsatile blood pressure curves according to age: young (left) and old (right) subjects. (b) Difference between central and peripheral blood pressure curves: invasive (back waveform) or noninvasive (front waveform)
20.1.1 Hemodynamic Patterns of Large Arteries: Methods of Measurement
The compliance, distensibility, or stiffness of an artery expresses the volume contained in the vasculature as a function of a given transmural pressure over a given physiological range [3, 11] (Table 20.1).
Table 20.1
Indices of arterial stiffness
Index | Definition |
|---|---|
Elastic modulus | The pressure (P) step required for 100 % stretch from resting diameter (D) at fixed vessel length: (ΔP·D)/ΔD (mmHg) |
Arterial distensibility | Relative diameter or area change for a pressure increment (inverse of elastic modulus): ΔD/(ΔP·D) (mmHg−1) |
Arterial compliance | Absolute diameter or area change for a given pressure step at fixed vessel length: ΔD/ΔP (cm/mmHg) or (cm2/mmHg) |
Volume elastic modulus | P step required for 100 % increase in volume (V) and no change in length: ΔP/(ΔV/V) (mmHg) ≡ ΔP/(ΔD/D) (mmHg) |
Young’s modulus | Elastic modulus per unit area, the pressure step per cm2 required for 100 % stretch from resting length (h is the wall thickness): ΔP·D/(ΔD·h) (mmHg/cm) |
Pulse wave velocity | Speed of the pulse along an arterial segment: distance/Δt (cm/s) |
Stiffness index | Ratio of logarithm (systolic/diastolic pressures) to (relative change in diameter):  |
Measurement of large artery stiffness is of particular interest in the evaluation of the functions of large arteries. Many approaches have been applied to quantify stiffness. Frequently these approaches represent approximations due to the heterogeneity of the matrix composition, orientation, and smooth muscle types of the arterial wall and variability of arterial wall at different locations [5, 12]. As shown in Table 20.1 a consensus agreement has been established on the terminology used in the literature to describe large-artery stiffness and on the reproducible noninvasive methodology to use [13].
Three major noninvasive methodologies are available for (a) estimation of artery diameter and distending pressure, (b) analysis of the arterial pulse pressure, and (c) measurement of pulse transit time.
Estimation of artery diameter and distending pressures can be achieved noninvasively and expressing these parameters as distensibility and compliance (change in diameter caused by a given change in pressure), Peterson’s elastic modulus (pressure change divided by the ratio of the change in diameter), and Young’s modulus (longitudinal force per unit area divided by extension per unit area) [14].
The analysis of arterial pulse pressure involves computerized recording of arterial pressure, arterial diameter, and flow velocity using tonometry, echography, and Doppler techniques and application of three- or four-electrical Windkessel model [15].
The third noninvasive method of evaluating artery stiffness is based on the measurement of pulse transit time [16]. The pulse wave velocity (PWV) analysis involves measurement of arterial pulse transit time between two recording sites on the skin surface. The PWV can be related to the elastic modulus of the arterial wall by a mathematical relationship which involves blood density and arterial geometry.
20.2 Microcirculation
The microcirculatory network represents that part of vascular district in which the major part of energy dissipation in order to overcome resistance occurs, and it includes small arteries (diameter 100–300 μm) and arterioles (diameter <100 μm) [17]. Small arteries contribute for about 30–50 % of precapillary blood pressure drop, although an additional 30 % drop occurs at the arteriolar level with a distribution of resistance that varies among different vascular beds [18]. We can say that the principal function of the microcirculation is to optimize nutrient and oxygen supply within the tissues in response to variations of demand and to minimize large fluctuations of hydrostatic pressure in the capillaries. Nevertheless it seems that the pulsatile behavior of blood pressure at the level of the small arteries has important functional consequences. First, pulsatility and myogenic tone are inversely related, implying that conduit arteries have no myogenic tone [19]. Second, the shear stress generated by each pulse wave excites release of endothelial nitric oxide, contributing to the degree of vasodilatation [20]. This allows forward progression of the pulse volume more distally and a change in reflection sites [21]. Thus the architectural design of the distal vascular tree has an influence on pulse pressure beyond the Windkessel (compliance/resistance) paradigm and implies a major role of wave reflections. The pulsatility of pressure exposes arteries in vivo to pulsed perfusion. The implication is that arteries are simultaneously exposed to phasic and static shear stress and stretch that activate different signal transduction pathways. Pressure oscillations elicit sustained afferent vasoconstriction, and the magnitude of the responses depends exclusively on the peak pressure [20, 22, 23]. It has been also shown that pulsed perfusion generates substantially different responses in endothelial nitric oxide synthesis, protein phosphorylation, and oxidative stress signaling [24].
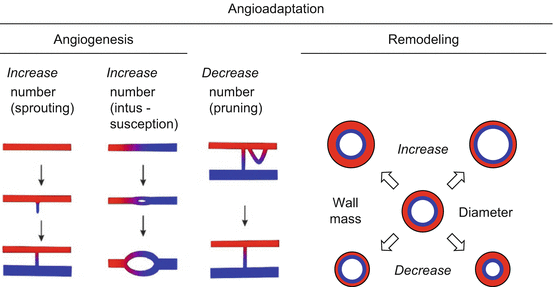
Microvascular beds and their functional structure are maintained by processes named angioadaptation [25] (Fig. 20.3). New vessels are generated by two different modes: sprouting and splitting [26–28]. With the establishment of blood flow, control of vascular development is increasingly taken over by feedback signals derived from vascular function including blood flow (shear stress) and blood pressure (circumferential wall stress) in addition to those derived from the metabolic state of the tissue [29, 30]. This allows elimination of vessels which are functionally inadequate by the process of pruning and adjustment of vessel properties (diameter, wall thickness) by remodeling. For angioadaptations, responses of endothelial cells to shear stress by the activation of a number of signal transduction pathways are crucial [31–36]. As a result of angioadaptation, the properties of vascular beds are determined by the interplay between vascular and cellular reactions to hemodynamic and molecular signals and the functional implications of these reactions, constituting a complex feedback system. Pathophysiological changes of vascular response may lead to vascular maladaptation, e.g., inward remodeling and rarefaction in hypertension.


Fig. 20.3
Mechanisms of angioadaptation. The number of vessels is changed by the process of angiogenesis and pruning, while the vessel diameter and wall thickness are affected by remodeling
20.2.1 Evaluation of Structural and Functional Patterns of Microcirculation
The methods for the evaluation of microvascular structural and functional characteristics available in humans are relatively few: histology, plethysmography, wire and pressure myography, and scanning laser Doppler flowmetry.
Histological approaches are charged with substantial pitfalls, due to the artifacts introduced by fixation, staining, and dehydration [17].
Plethysmography has been one of the first methods used in the evaluation of forearm blood flow and vascular resistance. The plethysmographic technique needs the occlusion of the brachial artery of the dominant arm, through the inflation of a sphygmomanometric bladder up to 300 mmHg for 13 min and then a dynamic exercise (20–30 handgrips against resistance). The arterial occlusion is rapidly removed, while venous occlusion is maintained (around 60 mmHg of pressure in the sphygmomanometric bladder). Arterial flow is measured every 10 s for 3 min by a mercury strain gauge, which evaluates the increased volume of the forearm. In the absence of venous backward flow, the increased forearm volume is proportional to the arterial flow. The mean blood pressure divided by the maximum arterial flow allows the calculation of minimum vascular resistance [37].
The methodological approach that had the widest application is represented by the wire or pressure micromyography, as it allows a reliable evaluation of structural changes within the vascular wall and of functional aspects as well. Wire micromyography was developed by Mulvany and Halpern in the 1970s [38], and it was applied in several vascular districts (mesenteric, cerebral, coronary, renal, femoral) of different animal models. This technique was also used for the evaluation of morphology and function of small arteries obtained from biopsies of the subcutaneous tissue from the gluteal or anterior abdominal region, in normotensive as well as in hypertensive patients [39, 40]. Technically, small artery segments (diameter 100–300 μm), obtained by dissection and made free of periadventitial fat tissue, are cannulated with stainless steel wires and mounted on a micromyograph paying attention to preserve the endothelium. A mechanical stretch may be applied through a micrometric screw, while a force transducer records the passive tension developed. Adding various substances to the bath, such as norepinephrine, potassium, and serotonin, it is possible to measure the contractile responses of the vessels. Subsequently the vessel, in a relaxed condition, is transferred on the stage of an immersion lens microscope, and through a micrometric ocular the wall thickness and the internal diameter are evaluated and cross-sectional areas and volumes calculated. The most relevant and useful parameter obtained with this approach is the tunica media/internal lumen ratio that it appears independent from the vessel’s dimensions [41].
An alternative to the wire micromyography is represented by perfusion-pressure micromyography. With this approach, isolated vessels are mounted in a pressurized myograph chamber and slipped into two glass microcannulae, connected to a perfusion system that allows a constant intraluminal pressure of 60 mmHg. Morphology of the vessels is evaluated by computer-assisted video analyzers. Vessels may be analyzed at a constant pressure or constant flow. Pressure micromyography allows a better evaluation of functional responses [42].
To avoid the invasiveness of these two methods, the interest of researchers was focused, in the last decade, on the retinal vascular district, as it represents the only microvascular bed that may be directly viewed with relatively simple approaches, such as an ophthalmoscope or a slit lamp [43]. One of the first attempts to precisely quantify structural alterations of retinal microcirculation was made by Wong et al. [44]. By means of an automated computerized method, they calculated the ratio between the arteriolar and venular external diameters (arterial-to-venular ratio, AVR) in circular segments of the retina. An additional approach was proposed by Hughes et al. [45] which demonstrated the possibility to quantify topological changes in retinal vascular architecture by means of a dedicated software. Harazny et al. [46, 47] proposed a method based on the association between confocal measurement of the external diameter of retinal arterioles and an evaluation of the internal diameter with a laser Doppler technique, with a comparison between the two images made by a dedicated software.
20.3 Arterial Changes in Pathophysiological Conditions
Hypertension is associated with important changes in the cross-sectional architecture (diameter and structure) of the arterial wall, influencing the quantitative (compliance and distensibility) or qualitative (stiffness) properties.
Hypertension enhances the arterial stiffening, and a chronic elevation of arterial pressure is accompanied by a reduction in overall arterial distensibility [48–50]. However, the effects of chronic blood pressure elevations on the mechanical properties of arteries of different structure and size are more complex. It has been shown that, compared to the values seen in normotensives, carotid and radial artery distensibilities were reduced in subjects with isolated systolic hypertension. This was not the case, however, in subjects with systo-diastolic hypertension in whom the reduction only involved carotid arterial distensibility [51]. Thus, alterations of arterial distensibility are not always uniform throughout the arterial tree. Several studies have also focused their attention on the functional factors modulating arterial distensibility in the absence of structural alterations. For example, it has been shown the radial artery distensibility can vary considerably in women throughout the menstrual cycle [52].
In the past, DBP was considered as the better guide to determine the severity of hypertension. Epidemiological studies have then directed attention to SBP as a more adequate for CV risk, and it has been shown that increased PP is an independent CV risk factor [53, 54]. Increased PP appears to be the most powerful measure available to identify those hypertensive patients at greatest risk for subsequent myocardial infarction [55, 56]. Because ventricular ejection and arterial stiffness are the main determinants of PP and because ventricular ejection tends to decrease with age, the question has arisen of whether pulse wave velocity, a classic marker of arterial stiffness, might be an independent predictor of CV mortality in subjects with hypertension. Calculation of CV risk using Framingham equations [57] indicates that in these subjects the 10-year CV mortality rate consistently increases with the increase in aortic PWV. After adjustment for age and other confounding variables, PWV is the best theoretical predictor of CV mortality.
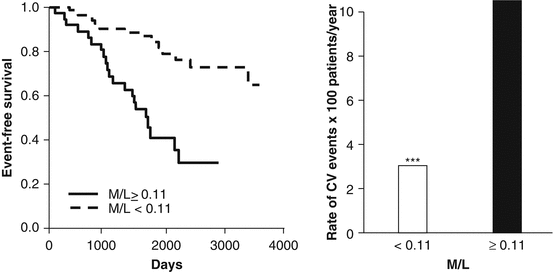
The damaging effect of local pulse pressure has been well demonstrated on large and small arteries. Elevated pulse pressure can stimulate hypertrophy, remodeling (increase media: lumen ratio), or rarefaction in the microcirculation, leading to increased resistance to mean flow and a vascular reserve worsening which may have important clinical consequences. Several studies showed a close relationship between microvascular damage in the heart, brain, kidney, and retina and either PP or arterial stiffness. Significant relationships have been demonstrated between brachial PP, arterial stiffness and carotid stiffness, and several target organ damages. Several papers have shown a close relationship with glomerular filtration rate and microalbuminuria [58–60], with white matter lesions or cognitive function [61, 62], with myocardial ischemia [63–65] (Fig. 20.4), and with retinal arteriolar narrowing [46, 66, 67].


Fig. 20.4
Event-free survival (Kaplan-Meier curves) in a group of patients with essential hypertension and with a media lumen (M/L) ratio of subcutaneous small arteries ≥0.11 (solid line) or <0.11 (dotted line) (left panel). Incidence of cardiovascular (CV) events in the two groups (right panel) (modified from [64])
In the last decade, with the progress of retinal imaging techniques, a number of observational studies were conducted to characterize the different abnormalities encountered and to determine the factors contributing to their onset. The main findings were the association between retinal arteriolar narrowing and the presence of hypertension or risk of hypertension onset [68–72]. The increase in retinal venular diameter has not been proven to be linked with hypertension, while a correlation was found with the presence of diabetes, obesity, metabolic disorders, smoking, inflammatory markers, endothelial dysfunction, and atherosclerotic markers [73, 74]. The relationship between these abnormalities and cardiovascular risk was also studied in a number of longitudinal studies [75]. The main findings were the increased risk of cardiovascular morbidity and mortality predominantly in individuals <75 years old, correlation with cerebral white matter lesions detected by MRI, increased risk of stroke, and deterioration in cognitive function [76]. Concerning coronary artery disease, the MESA study [77] showed a correlation between the presence of reduced arteriolar caliber and coronary calcifications as observed by CT scan. The association between retinal microvascular abnormalities and the incidence of coronary artery disease, heart failure, and cardiovascular mortality has been observed in several prospective studies [44, 78, 79].
It needs to be mentioned the findings observed in two different pathophysiological conditions, such as obesity and diabetes, associated, with or without the hypertensive state, with an increased morbidity and mortality rate. Obesity is characterized by vascular alterations that involve not only large- and medium-sized arteries [80], but they extend also to the microcirculation as well [81]. The hypertrophic remodeling of the vessel wall is associated with a marked impairment in endothelium-dependent vasodilatation but with a preserved wall stiffness, presumably because the tunica media content of collagen/elastin is not markedly altered. In this condition neural (sympathetic activation) and metabolic (insulin, leptin, adipokines, tumor necrosis factor) factors seem to be the major candidates for the development and progression of vascular hypertrophy and endothelial dysfunction [81].
Similar observations can be reported in patients affected by diabetes mellitus. A marked alteration in small artery structure, an increase in media cross-sectional area (suggesting the presence of hypertrophic remodeling), a correlation between plasma insulin levels and media-to-lumen ratio of subcutaneous small arteries, and an impairment in myogenic response are present in diabetic patients [82, 83]. A functional and structural capillary rarefaction can also be observed in diabetic patients [84]. These alterations favor the target organ damage, particularly at the level of the eyes, kidneys, nerves, and heart. Several studies have clearly shown that these microvascular alterations in diabetic patients are associated with a significant increase in cardiovascular morbidity and mortality; diabetic retinopathy is associated with 1.7-fold increased risk and nephropathy with 2.0-fold increased risk [85].
Stay updated, free articles. Join our Telegram channel

Full access? Get Clinical Tree


