Approaches to Interpreting Pulmonary Function Tests
Different experts follow different approaches to interpretation of pulmonary function tests. There is no universally accepted standard for interpretation, but the two most commonly cited standards have been the 1986 American Thoracic Society (ATS) Disability Standard1 and the 1991 statement of the ATS.2 In 2005, the ATS and the European Respiratory Society (ERS) updated the pulmonary function interpretation strategies.3
This chapter describes three approaches (Sections 14A, 14B and 14C). The first uses the flow-volume curve and the normal predicted values. The second uses the test data without the flow-volume curve. The third uses a pulmonary function test “crib sheet” developed in the Mayo Clinic Division of Pulmonary and Critical Care Medicine as an instructional tool for residents and fellows.
14A. Flow-Volume Curve Available Step I
Examine the flow-volume curve and compare it with the normal predicted curve (see the Appendix for how we construct the normal curve). Is there any ventilatory limitation (i.e., any loss of area)? If not, the test result is most likely normal.
1. Is the forced expiratory vital capacity (FVC) normal? If so, any significant restriction is essentially ruled out.
2. Is the FVC reduced? If so, either obstruction or restriction could be the cause (see Fig. 2-3, page 8).
3. Examine the contour of the flow-volume curve.
a. Is it normal appearing (Fig. 14-1)? If so, and if the FVC is normal, the test result is almost always normal.
PEARL: But remember there are three possible exceptions: (1) early respiratory muscle weakness, (2) extrathoracic major airway lesion, and (3) asthma in remission.
Proceed to steps V, VI, and VII. If the FVC is reduced and the flow-volume slope and ratio of forced expiratory volume in 1 second to FVC (FEV1/FVC ratio) are normal, restriction, occult asthma, or a nonspecific abnormality may be present (see Section 2F, page 10, and Section 3E, page 29). The total lung capacity (TLC) will have to be measured to make the differentiation.
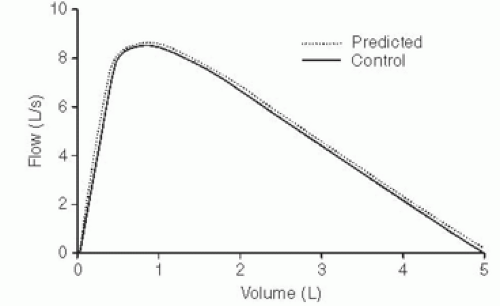 FIG. 14-1. Normal flow-volume curve. |
b. Is the curve scooped out with reduced flow-volume slope and low flows (Fig. 14-2)? An obstructive defect is most likely. Remember the occasional mixed restrictive-obstructive disorder.
4. Is the slope of the flow-volume curve increased (Fig. 14-3)? This finding is consistent with a pulmonary parenchymal restrictive process. The FVC, TLC, and diffusing capacity of carbon monoxide (DLCO) must be reduced to be certain. (Grading the degree of restriction is described in Section 14C.)
5. If there is a flow-volume loop, is there any suggestion of a major airway lesion (Fig. 14-4)?
Step II
Examine the FEV1 value.
1. Is it normal? If so, all but borderline obstruction or restriction is ruled out. There are exceptions, namely, the rare variable extrathoracic
lesion in which the FEV1 can be normal but the maximal voluntary ventilation (MVV) is reduced because of inspiratory obstruction (as in Fig. 14-4A). In addition, subjects with respiratory muscle weakness (see Section 9D, page 80) can initially present with dyspnea and a normal FEV1.
lesion in which the FEV1 can be normal but the maximal voluntary ventilation (MVV) is reduced because of inspiratory obstruction (as in Fig. 14-4A). In addition, subjects with respiratory muscle weakness (see Section 9D, page 80) can initially present with dyspnea and a normal FEV1.
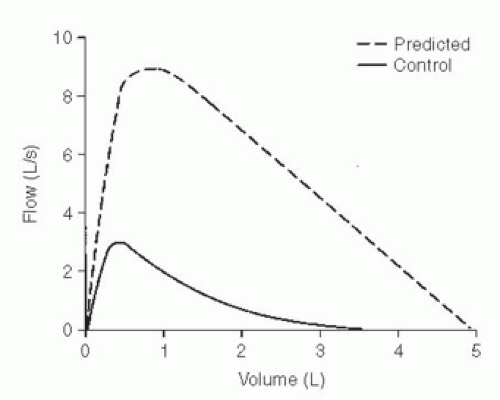 FIG. 14-2. Flow-volume curve in severe chronic obstructive pulmonary disease. |
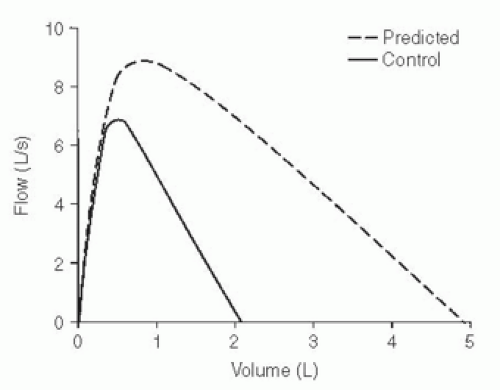 FIG. 14-3. Flow-volume curve in pulmonary fibrosis. Note the steep slope and decreased volume. |
2. Is the FEV1 reduced below the lower limit of normal (LLN)? (The equation used to determine the LLN is in the Appendix.) If FEV1 is reduced, the decrease is most often due to airway obstruction. It could be caused by a restrictive process, however, and thus, the FEV1/FVC ratio needs to be evaluated. Nevertheless, if the TLC value is available, check it first. An increase in TLC by more than 15% to 20% favors obstructive disease. A normal or increased TLC value excludes a pulmonary restrictive process by definition. A normal TLC can occur in the rare mixed obstructive-restrictive disorder. A reduced TLC is expected with a restrictive process.
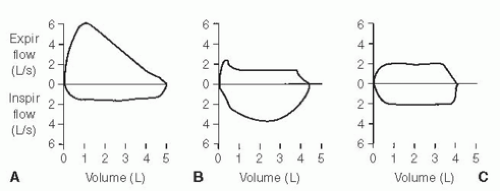 FIG. 14-4. Typical flow-volume curves associated with lesions of the major airway (carina to mouth). A. Typical variable extrathoracic lesion. B. Variable intrathoracic lesion. C. Fixed lesion. Expir, expiratory; Inspir, inspiratory. |
Step III
1. If the absolute ratio is decreased to below the LLN, an obstructive process is present. (Grading the degree of obstruction is described in Section 14C.)
2. If the ratio is normal, an obstructive process is usually excluded. An exception is the case of the nonspecific pattern, in which the FVC and FEV1 are reduced and the FEV1/FVC ratio, flow-volume slope, and TLC are all normal (see Section 3E, page 29). Administration of a bronchodilator often exposes occult asthma (Fig. 14-5), but occasionally a methacholine challenge test is needed. Airway resistance, if available, is often increased and can be helpful in identifying the patient with occult asthma.
3. The ratio is normal or increased with a pure restrictive disorder. Patients with a reduced FVC, reduced FEV1, normal to increased FEV1/FVC ratio, and normal response to bronchodilator may have a restrictive process. If there is doubt, have the TLC or DLCO measured; they should be abnormally low. If the TLC test is not available, check the chest radiograph for evidence of reduction in TLC, or estimate TLC by the radiographic technique discussed in Section 3C. The alveolar volume (VA) can also be checked, as discussed in the Pearl in Section 4B.
Step IV
Examine the expiratory flow values.
1. The forced expiratory flow rate over the middle 50% of the FVC (FEF25-75) almost always changes in the same direction as the FEV1.
This test may be more sensitive for detecting early airway obstruction. The FEF25-75 is occasionally reduced in the face of a normal FVC, FEV1, and MVV. The flow-volume curve has a characteristic appearance. This result tends to occur in elderly persons with minimal symptoms (Fig. 14-6). Also see Section 7A (Fig. 7-5).
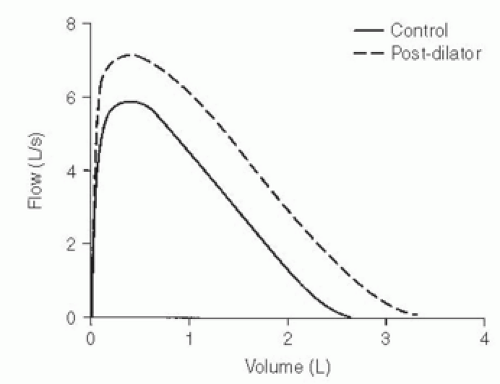 FIG. 14-5. Control curve shows mild reduction in forced expiratory vital capacity (FVC) and forced expiratory volume in 1 second (FEV1) and a normal FEV1/FVC ratio. After administration of a bronchodilator, the flow-volume curve (dashed line) shows a parallel shift to the right with an increase in FVC and FEV1 but no change in the FEV1/FVC ratio. The patient has occult asthma. |
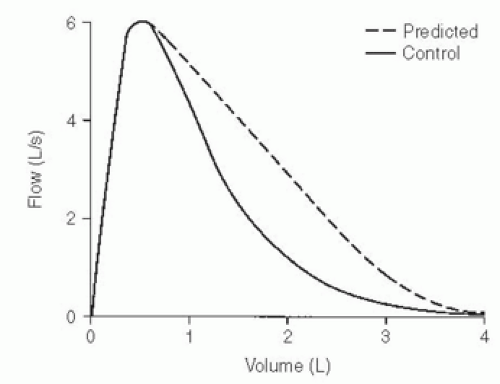 FIG. 14-6. The unusual flow-volume curve in which the forced expiratory volume in 1 second is normal but the forced expiratory flow rate over the middle 50% of the forced expiratory vital capacity is reduced. Note that the peak flow is normal but the lower 70% is very scooped out. |
Step V
Examine the MVV if you have one.
1. The MVV will change in most cases in a manner similar to that of the FEV1. With a normal FEV1, a normal MVV should be expected (FEV1 × 40 = predicted MVV). Consider the lower limit to be FEV1 × 30.
2. If the FEV1 is reduced by obstructive disease, the MVV will also be reduced. However, the rule that FEV1 × 40 = MVV is not always true in obstructive disease.
3. If the FEV1 is reduced by a restrictive process, the MVV usually is reduced, but not always as much as suggested by the FEV1 [some subjects with a very steep flow-volume curve can have normal flows high in the vital capacity (VC); see Fig. 2-4D].
4. If the FEV1 is normal but the MVV is reduced below the lower limit, consider the following possibilities:
a. Poor patient performance due to weakness, lack of coordination, fatigue, coughing induced by the maneuver, or unwillingness to give maximal effort (best judged by the technician).
b. Does the patient have a neuromuscular disorder? The MVV is usually the first routine test to have an abnormal result. Consider ordering maximal respiratory pressure tests (see Chapter 9).
c. Does the subject have a major airway lesion? The MVV is reduced in all three types of lesions shown in Figure 14-4; to evaluate this, the flow-volume loop needs to be evaluated.
Stay updated, free articles. Join our Telegram channel

Full access? Get Clinical Tree


