Fig. 17.1
Typical finding of normal aortic valve and aortic root. Oblique axial images of CT (a, b) show normal-sized opening of aortic valve in mid-systole (a) and normal coaptation of the three cusps of aortic valve in mid-diastole (b). R right coronary sinus, L left coronary sinus, N noncoronary sinus
17.2 Imaging Role of Echocardiography, Cardiac CT, and Cardiac MRI
Echocardiography is the primary imaging tool used to evaluate the aortic valve disease with high temporal resolution, allowing to characterization of valve anatomy and function.
Echocardiography is operator dependent and sometimes inadequate for comprehensive evaluation of aortic valve diseases.
Cardiac computed tomography (CT) and magnetic resonance imaging (MRI) are used for evaluation of aortic valve diseases and determination of the hemodynamic effects of the heart in patients with inconclusive findings at echocardiography.
Cardiac CT and MRI provide more accurate information of valvular morphology and ascending aorta anatomy than echocardiography in severe calcific aortic stenosis.
Valvular calcification is detected and quantitatively measured on cardiac CT.
Cardiac CT with retrospective electrocardiography (ECG)-gating and tube current modulation is used to make cine imaging for aortic valvular cusp mobility and coaptation, providing information about stenotic aortic valve area (AVA) and regurgitant orifice area (ROA).
Cardiac MRI with balanced steady-state free precession (b-SSFP) cine pulse sequence and phase-contrast (PC) pulse sequence is used for aortic valve morphology, qualitative and quantitative information of valvular dysfunction, and accurate assessment of the left ventricular (LV) function and mass.
Cardiac MRI with delayed contrast enhancement and T1 mapping allows for the noninvasive detection and quantification of myocardial fibrosis in patients with severe aortic valve disease.
17.3 Aortic Valve Disease
17.3.1 Aortic Stenosis (AS)
The most common single cardiac valvular lesion.
The main causes of AS include age-related degenerative calcified AS of an anatomically normal valve or atherosclerotic TAV, congenitally BAV, and rheumatic VHD.
In the ACC/AHA guidelines, severe AS is defined as (1) a peak aortic velocity greater than 4 m/s, (2) a mean pressure gradient greater than 40 mmHg, or (3) an AVA less than or equal to 1 cm2 (Table 17.1) [3].
Classical triad of angina, syncope, and heart failure.
Treatment: valve replacement, percutaneous balloon valvuloplasty, and transcatheter aortic valve implantation.
Table 17.1
Grade of the severity of AS (echocardiography)
Mild
Moderate
Severe
Valve area (cm2)
>1.5
1.0–1.5
<1.0
Mean pressure gradients (mmHg)
<25
25–40
>40
Peak jet velocity (m/s)
<3.0
3.0–4.0
>4.0
Valve area index (cm2/m2)
<0.6
17.3.2 Aortic Regurgitation (AR)
AR can be caused by a wide variety of disease processes affecting the valve cusps or commissures (bicuspid aortic valve, rheumatic heart disease, infective endocarditis, systemic disease), aortic root (hypertension, annuloaortic ectasia, systemic disease, aortic dissection), or both.
Clinically, chronic AR is insidious and well tolerated for decades, but acute AR may lead to sudden heart failure or cardiogenic shock.
Severe AR is defined as (1) a vena contracta width >6 mm, (2) proximal regurgitant jet width in comparison to the height of the left ventricular outflow tract (LVOT) ≥65 %, (3) regurgitant volume ≥60 ml/beat, (4) regurgitant fraction (RF) ≥50 %, or (5) effective ROA ≥0.3 cm2 (Table 17.2) [3].
Table 17.2
Grade of the severity of AR (echocardiography or catheterization)
Mild
Moderate
Severe
Color Doppler jet width
Central jet, width <25 % of LVOT
>Mild but no sign of severe AR
Central jet, width >65 % of LVOT
Doppler vena contracta width (cm)
<0.3
0.3–0.6
>0.6
Regurgitant volume (ml/beat)
<30
30–59
≥60
Regurgitant fraction (%)
<30
30–49
≥50
Regurgitant orifice area (cm2)
<0.10
0.10–0.29
≥0.30
17.4 Quantitative Techniques of Comprehensive Assessment of Aortic Valve Diseases Using CT
17.4.1 Measurement of Valvular Calcification
Aortic valve calcium score correlates with AS severity, and not with aortic valve morphology (Fig. 17.2) [4].
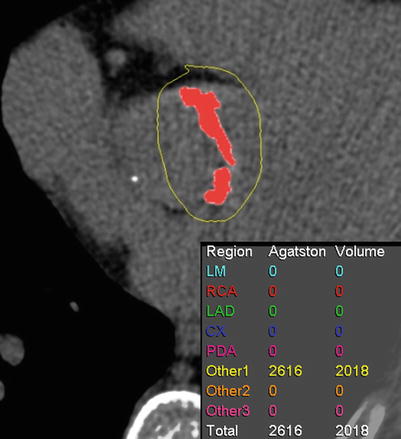
Fig. 17.2
Measurement of valvular calcification. Oblique axial image of pre-contrast CT shows that the amount of aortic valve calcification is expressed as an Agatston score and volume score
17.4.2 Measurement of AVA and ROA Using Cardiac CT
Phases of maximal opening (mid-systole, approximately 20 % of the R-R interval) and closing (mid-diastole, approximately 60–70 % of the R-R interval) of the aortic valve are determined by reviewing dynamic cine images.
Cross-sectional planimetric images are used to measure the smallest stenotic AVA (commonly at the tips of the cusps) and ROA parallel to the plane described by the borders of the aortic cusps (both the aortic root long axis and its orthogonal plane).
The valve plane for planimetry of ROA is reconstructed parallel to the regurgitant orifice in case of eccentric AR.
A trend toward slight overestimation of anatomic AVA using CT planimetric measurement compared with effective stenotic AVA using echocardiography.
No established cutoff value for grading AR using anatomic ROA even though differentiation among mild, moderate, and severe degrees of AR with cardiac CT is highly accurate when cutoff ROAs (25 and 75 mm2) are used (Figs. 17.3 and 17.4) [1, 5, 6].
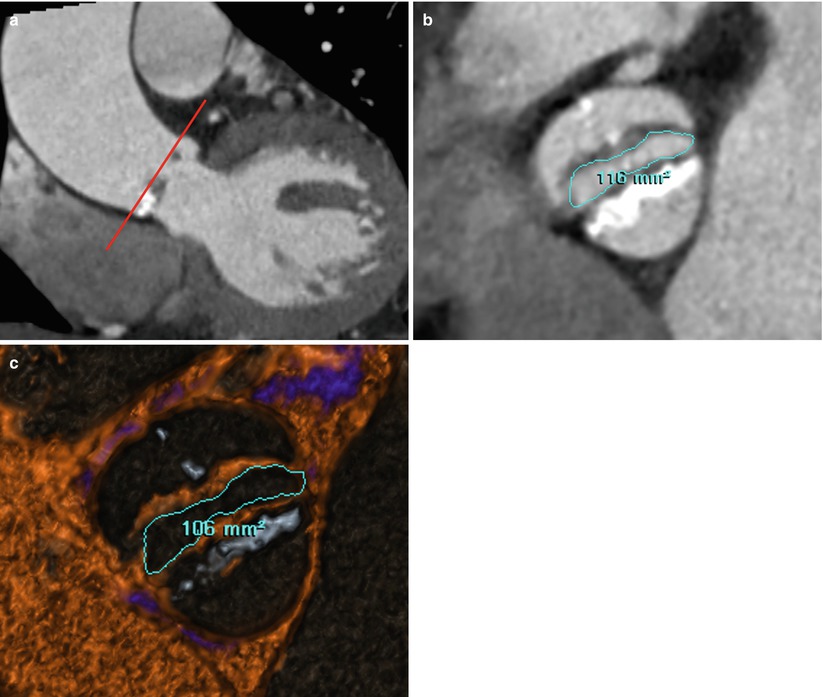
Fig. 17.3
Example of measurement of AVA in patient with BAV stenosis. (a, b) Oblique coronal (a) image of CT demonstrates that measurement of the AVA in the plane described by the borders of the aortic cusps (red line). AVAs by planimetry are 1.16 and 1.06 cm2 on CT oblique axial image (b) and CT thick-slab volumetric four-dimensional reconstruction image with blood pool inversion technique (c), respectively
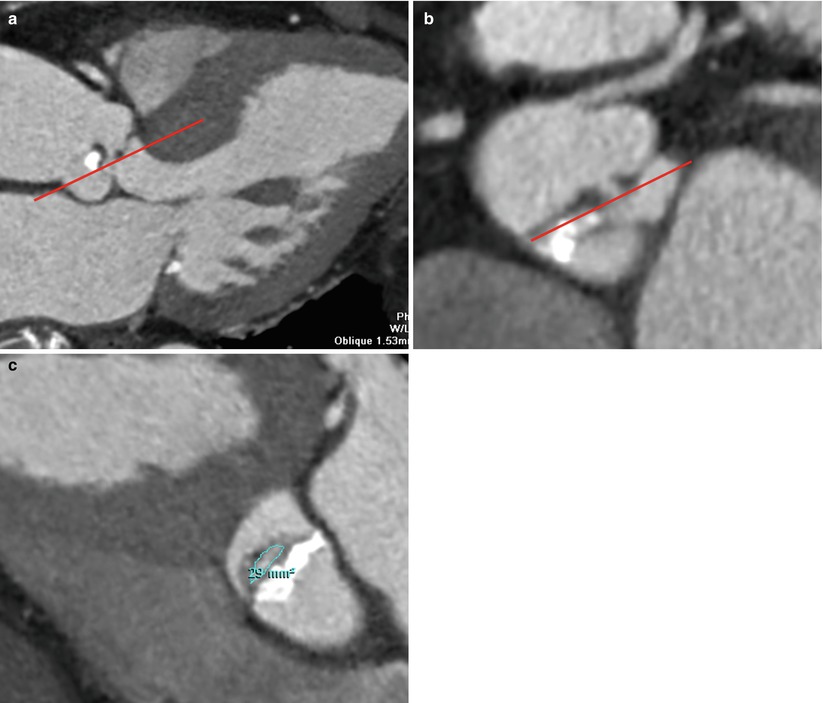
Fig. 17.4
Example of measurement of ROA in patient with eccentric AR. (a, b) On an oblique sagittal projection of the aortic root (a), a transversely orient oblique plane parallel to the regurgitant orifice is placed to produce a modified oblique axial reconstruction of the aortic valve (b). A transverse cut-plane parallel to the regurgitant orifice is placed on the modified oblique axial reconstruction of the aortic valve (b). (c) This transverse cut-plane yields a double oblique axial image of aortic valve for true ROA
17.4.3 Measurement of Ascending Aorta Dimensions
The diameters of ascending aorta are measured at 4 levels using oblique coronal reconstruction during mid-diastole: level 1, aortic annulus, defined as the hinge points of the aortic valve cusps; level 2, midpoint of the aortic sinuses of Valsalva; level 3, sinotubular junction; level 4, tubular portion, defined as the level of the right pulmonary artery.
Patients with severe bicuspid aortic valve (BAV) stenosis have significantly larger ascending aorta diameters than in those with tricuspid aortic valve (TAV) stenosis (Fig. 17.5) [7].
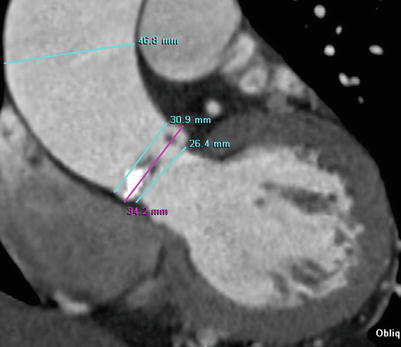
Fig. 17.5
Example of measurement of ascending aorta dimensions. Oblique coronal image of CT shows the measurement of aortic root and tubular portion of the ascending thoracic aorta during mid-diastole in patient with severe BAV stenosis. BAV stenosis is related to aneurysmal dilatation of the tubular portion of the ascending aorta as like this case
17.4.4 Measurement of LVOT Area and Diameters
The LVOT area and diameters are measured below the aortic valve and perpendicular to both the aortic root long axis and its orthogonal plane during mid-systole.
When the true area of LVOT is determined by planimetry and entered into the continuity equation, the difference between flow-derived echocardiographic and anatomic determinations of AVA decreases.
The measurement of LVOT planimetry provides information about septal myectomy at the time of aortic valve replacement for severe AS (Fig. 17.6).
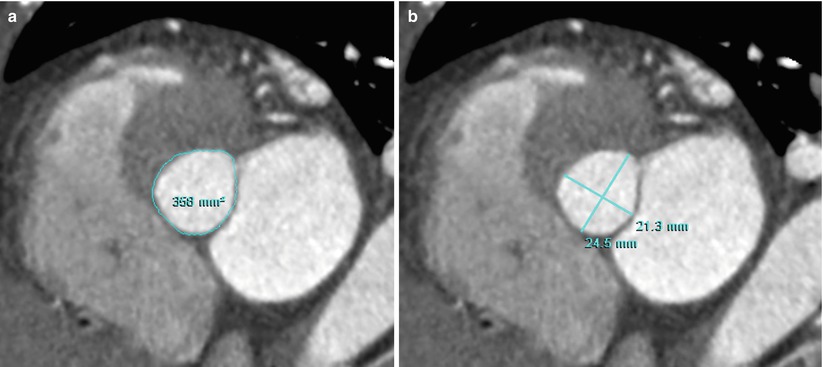
Fig. 17.6
Example of measurement of LVOT area and diameters. (a, b) Double oblique axial images of CT show the measurement of area (a) and diameters (b) of the most narrowed LVOT portion during mid-systole
17.4.5 Measurement of LV Volume and Systolic Function
LV end-diastolic volume (EDV), end-systolic volume (ESV), stroke volume (SV), and ejection fraction (EF) are calculated using short-axis cine images with end-systolic phase and end-diastolic phase and attenuation-based segmentation.
Cardiac CT measurements of global LV function using attenuation-based technique are highly reproducible and compared more favorable with the cardiac MRI using Simpson’s method than echocardiography using modified Simpson’s method.
17.5 Quantitative Techniques of Comprehensive Assessment of Aortic Valve Disease Using MRI
17.5.1 Velocity Quantification for the Grade of AS Severity
PC cardiac MRI is a technique to quantify blood flow and velocity and is based on the accumulated phase of moving protons.
Measurement of velocity in the blood is assessed at the “through-plane” imaging plane that is positioned perpendicular to the vessel.
“In-plane” phase-contrast pulse sequences, allowing assessment of velocity along the course of a flow jet, and can assist in planning the “through-plane” slice.
PC cardiac MRI generates a magnitude image reflecting the anatomy of the chosen imaging plane, and phase velocity maps encoding the velocities within each voxel.
The pressure gradient across the aortic valve is estimated by the modified Bernoulli equation, ΔP = 4V 2, where P is the pressure (mmHg) drop across the stenosis and V is velocity (m/s).
An important tendency to underestimate the true value in severe AS in flow-based assessment using phase-contrast cardiac MRI because of the lower temporal resolution of cardiac MRI than Doppler echocardiography and intravoxel dephasing of spins related in part to acceleration, turbulence, and partial volume averaging within the vena contracta (Fig. 17.7) [2].
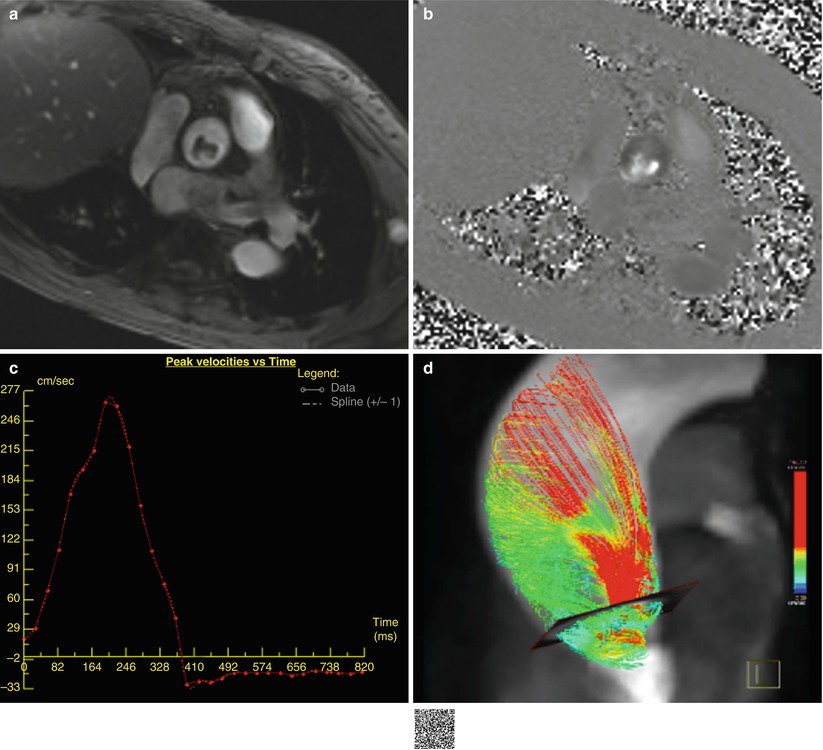
Fig. 17.7
Example of velocity mapping in AS. (a, b) Quantitative through-plane flow assessment above aortic valve using the PC cardiac MRI. Magnitude image (a), phase image (b), corresponding PC velocity map (c), and 4D flow image (d). The peak velocity is 2.7 m/s with an estimated pressure gradient of 29 mmHg according to the modified Bernoulli equation. Abnormal systolic helical flow is seen in the aneurysmal ascending thoracic aorta of patient with severe BAV stenosis on 4D flow image (d) (http://extras.springer.com/2015/978-3-642-36396-2)< div class='tao-gold-member'>Only gold members can continue reading. Log In or Register to continue
Stay updated, free articles. Join our Telegram channel

Full access? Get Clinical Tree


