We sought to determine the angiographic severity of coronary lesions leading to ST-segment elevation myocardial infarction (STEMI) and non-STEMI (NSTEMI) with a focus on determining the impact of interval from initial angiogram to subsequent clinical event. In the late 1980s angiographic data on lesion characteristics that culminated in STEMI and NSTEMI were obtained from angiograms obtained several months before MI. It is not clear whether the conclusions on lesion severity would be different if elapsed interval from baseline angiogram to clinical event was factored in the analysis. From 2003 through 2010, we identified 84 patients with NSTEMI and 41 patients with STEMI in vessels without previous intervention. These patients had ≥1 previous angiographic study at our center. Angiograms were reanalyzed with quantitative coronary angiography, and relevant clinical data were obtained from medical records. Similar to previous studies, 71% of patients with STEMI and 63% of patients with NSTEMI had <50% baseline stenosis at the culprit site when the interval from initial angiogram to MI was >3 months. Interestingly, lesions that led to STEMI ≤3 months after evaluation were more severe than those leading to STEMI in >3 months (59 ± 31% vs 36 ± 21%, p = 0.02) with 57% of lesions having >50% stenosis. Although most MIs occurred at sites that did not have significant obstruction when examined >3 months before MI, most baseline lesions showed significant luminal narrowing when examined ≤3 months before STEMI. In conclusion, high-grade coronary stenosis may be an important predictor of STEMI in subsequent months.
Attempts at predicting myocardial infarction (MI) using angiography led to several studies published in the late 1980s and early 1990s. These studies demonstrated uncoupling of angiographic stenosis and subsequent events and challenged therapeutic decision making based on angiographic stenosis. It is important to note that intervals from the initial angiogram to subsequent MI were several months in most of these studies. Data on angiographic lesion characteristics studied a few months or days before MI are scarce. Furthermore, over the years, advancements in cardiovascular pharmacology, widespread use of lipid-lowering therapy, and an emphasis on aggressive cardiovascular risk factor modification have influenced the natural history of coronary artery disease considerably. Therefore, our objective was to determine angiographic characteristics of lesions leading to ST-segment elevation myocardial infarction (STEMI) or non-STEMI (NSTEMI) in the contemporary era, with an emphasis on the interval between angiograms.
Methods
The diagnostic and interventional catheterization database at the Cleveland Clinic from January 2003 to January 2010 was used for this study. All patients with STEMI or NSTEMI undergoing percutaneous intervention on a clearly identified culprit lesion were considered for inclusion. Patients were included in the study if they had a previous coronary angiogram at our institution. Patients with culprit lesions identified in a bypass graft, a previously stented vessel, or a transplanted heart were excluded. Patients with angiograms that were not of optimal quality for quantitative coronary angiographic analysis were also excluded. We defined STEMI as chest pain with STE of >1 mm in ≥2 contiguous leads or a new-onset left bundle branch block with positive biomarkers. NSTEMI was defined as chest pain with no significant STE but with the presence of myocardial injury detected by positive cardiac biomarkers.
Clinical characteristics, laboratory testing, and imaging information were extracted from electronic medical records. The 2-year Framingham risk score was calculated using models described previously. The 2-year risk score was chosen over the 10-year score because the median interval between 2 catheterizations in our study sample was approximately 2 years. Angiographic data were analyzed by 2 trained researchers (A.G.A. and T.Z.) using the QuantCor 5.0 quantitative coronary angiographic application (CAAS II, Pie Medical Imaging, Maastricht, the Netherlands) or SyngoDynamics 9.0 (Siemens Medical Solution USA, Inc., Malvern, Pennsylvania). At the time, second angiogram, clinical presentation including electrocardiographic changes, and angiographic data of intervened sites were carefully studied to identify the “culprit lesion” site. Patients undergoing revascularization of multiple areas were excluded because the culprit lesion site could not be determined. We then went back and studied the first angiogram to identify the same site where the culprit lesion had developed, subsequently referred to as the “baseline lesion.” We performed quantitative and qualitative analyses of this site according to American College of Cardiology/American Heart Association conventions. Time-based analysis was done to determine how differences in lesion severity varied with time. We used 3 months as the cutoff for our analysis, which, although arbitrary, was derived from the distribution of intervals between angiograms in our study cohort.
Consistent with previous studies, significant lesions were defined as those with ≥50% stenosis at baseline. To study the influence of interval between the 2 angiograms, we measured stenosis of the culprit lesion on baseline angiograms. The entire study population was divided into lower and higher stenosis groups using the median value for the entire group. Lesion length, minimum lumen diameter, reference diameter, and percent diameter stenosis were measured using quantitative coronary angiography. Other characteristics such as lesion location, contour, eccentricity, and calcification were also determined. We ascertained acceptable levels of intra- and interobserver variabilities by comparing 95% limits of agreement of quantitative coronary angiographic readings on a set of 20 angiograms analyzed 2 times—at the beginning and then at the end of the data collection—by the 2 investigators.
Data were analyzed using chi-square test for categorical variables and Student’s t test for continuous variables. Statistical analysis was done using SAS 9.2 (SAS Institute, Cary, North Carolina). The protocol for this study was approved by the Cleveland Clinic’s institutional review board.
Results
Of the 1,229 NSTEMI and 1,207 STEMI interventions reviewed, 84 patients with NSTEMI and 41 with STEMI met the inclusion criteria. Their clinical characteristics are presented in Table 1 . Patients with STEMI were younger compared to patients with NSTEMI. Although male gender and current smoking status was more common in patients with STEMI, other cardiovascular risk factors such as diabetes, dyslipidemia, and obesity were more frequently seen in patients with NSTEMI. The 2-year Framingham risk score did not differ between the 2 groups. Interval from the first angiogram to MI was similar in the 2 groups.
| Variable | NSTEMI | STEMI | p Value |
|---|---|---|---|
| (n = 84) | (n = 41) | ||
| Age (years) | 66.8 ± 12.7 | 61.7 ± 11.8 | 0.03 |
| Men | 44 (52.4%) | 30 (73.2%) | 0.03 |
| Body mass index (kg/m 2 ) | 31.0 ± 7.2 | 28.7 ± 6.0 | 0.08 |
| Diabetes mellitus | 41 (48.8%) | 12 (29.3%) | 0.04 |
| Hypertension | 78 (92.9%) | 37 (90.2%) | 0.6 |
| Dyslipidemia | 73 (86.9%) | 30 (73.2%) | 0.06 |
| Current smoking | 12 (14.3%) | 14 (34.1%) | 0.01 |
| Stroke | 5 (6.0%) | 0 | 0.1 |
| Peripheral artery disease | 2 (2.4%) | 4 (9.8%) | 0.07 |
| Renal failure | 4 (4.8%) | 7 (17.1%) | 0.02 |
| Congestive heart failure | 10 (11.9%) | 0 | 0.02 |
| Interval (months) | 27.6 ± 20.4 | 23.8 ± 19.2 | 0.3 |
| Low-density lipoprotein (mg/dl) | 98.3 ± 38.9 | 107.6 ± 53.3 | 0.2 |
| High-density lipoprotein (mg/dl) | 48.6 ± 14.9 | 49.2 ± 16.2 | 1.0 |
| Triglyceride (mg/dl) | 168.1 ± 127.6 | 101.1 ± 52.7 | 0.008 |
| Hemoglobin A1C (%) | 5.1 ± 2.9 | 6.6 ± 1.9 | 0.04 |
| Systolic blood pressure (mm Hg) | 145.6 ± 27.2 | 136.9 ± 20.0 | 0.08 |
| Diastolic blood pressure (mm Hg) | 77.1 ± 13.4 | 78.4 ± 13.5 | 0.6 |
| 2-Year Framingham risk score | 7.7 ± 3.3 | 7.2 ± 2.8 | 0.5 |
| Aspirin | 45 (53.6%) | 26 (63.4%) | 0.3 |
| β Blockers | 56 (66.7%) | 23 (56.1%) | 0.3 |
| Angiotensin-converting enzyme inhibitors | 54 (64.3%) | 16 (38.1%) | 0.007 |
| Calcium channel blockers | 12 (14.3%) | 5 (12.2%) | 0.7 |
| Diuretics | 37 (44.0%) | 9 (22.0%) | 0.02 |
| Statins | 39 (46.4%) | 30 (73.2%) | 0.005 |
| Clopidogrel | 22 (26.2%) | 17 (41.5%) | 0.08 |
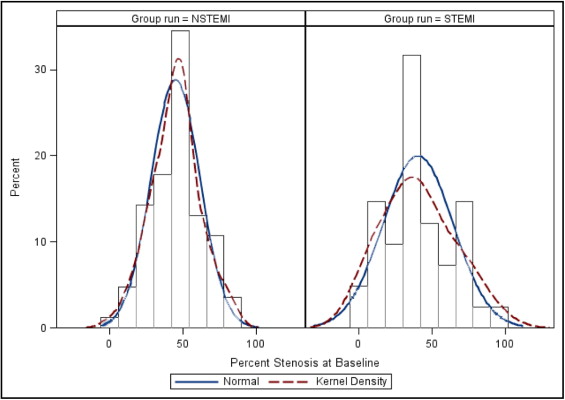
Similar to previously reported studies, most baseline lesions had <50% stenosis ( Table 2 ). Mean stenosis of baseline lesions was not statistically different between the STEMI and NSTEMI groups. Median stenosis (interquartile range) of lesions leading to STEMI and NSTEMI were 38% (21 to 57) and 47% (35 to 54), respectively. There was no difference in the distribution of other significant lesions between patients with NSTEMI and those with STEMI.
| Baseline Lesion Characteristics | NSTEMI | STEMI | p Value |
|---|---|---|---|
| (n = 84) | (n = 41) | ||
| Stenosis (%) | 44.8 ± 16.6 | 40.4 ± 24.0 | 0.2 |
| Lesion length (mm) | 6.9 ± 4.9 | 8.2 ± 6.1 | 0.2 |
| American College of Cardiology/American Heart Association lesion type | |||
| A | 35 (42.2%) | 25 (61.0%) | 0.04 |
| B1 | 19 (22.9%) | 7 (17.1%) | 0.5 |
| B2 | 10 (11.9%) | 4 (9.8%) | 0.7 |
| C | 20 (24.1%) | 5 (12.2%) | 0.1 |
| Irregular lesions | 14 (16.7%) | 9 (22.0%) | 0.5 |
| Eccentric (%) | 11 (13.1%) | 9 (22.0%) | 0.2 |
| Calcification (%) | 21 (25%) | 6 (14.6%) | 0.2 |
| Infarct-related artery vessel category | |||
| Left main coronary artery trunk | 1 (1.2%) | 0 | 0.5 |
| Left anterior descending coronary artery | |||
| Proximal | 14 (16.7%) | 9 (22.0%) | 0.5 |
| Mid distal | 16 (19.0%) | 9 (22.0%) | 0.7 |
| Left circumflex coronary artery | |||
| Proximal | 14 (16.7%) | 1 (2.4%) | 0.02 |
| Mid distal | 13 (15.5%) | 5 (12.2%) | 0.6 |
| Right coronary artery | |||
| Proximal | 5 (6.0%) | 4 (9.8%) | 0.4 |
| Mid distal | 21 (25.0%) | 13 (31.7%) | 0.4 |
| All lesions | |||
| Proximal | 33 (39.3%) | 14 (34.1%) | 0.6 |
| Mid distal | 50 (59.5%) | 27 (65.9%) | 0.5 |
| Number of coronary arteries | |||
| 0 | 27 (32.1%) | 10 (24.4%) | 0.4 |
| 1 | 24 (28.6%) | 11 (26.8%) | 0.8 |
| 2 | 18 (21.4%) | 10 (24.4%) | 0.7 |
| 3 | 15 (17.9%) | 10 (24.4%) | 0.4 |
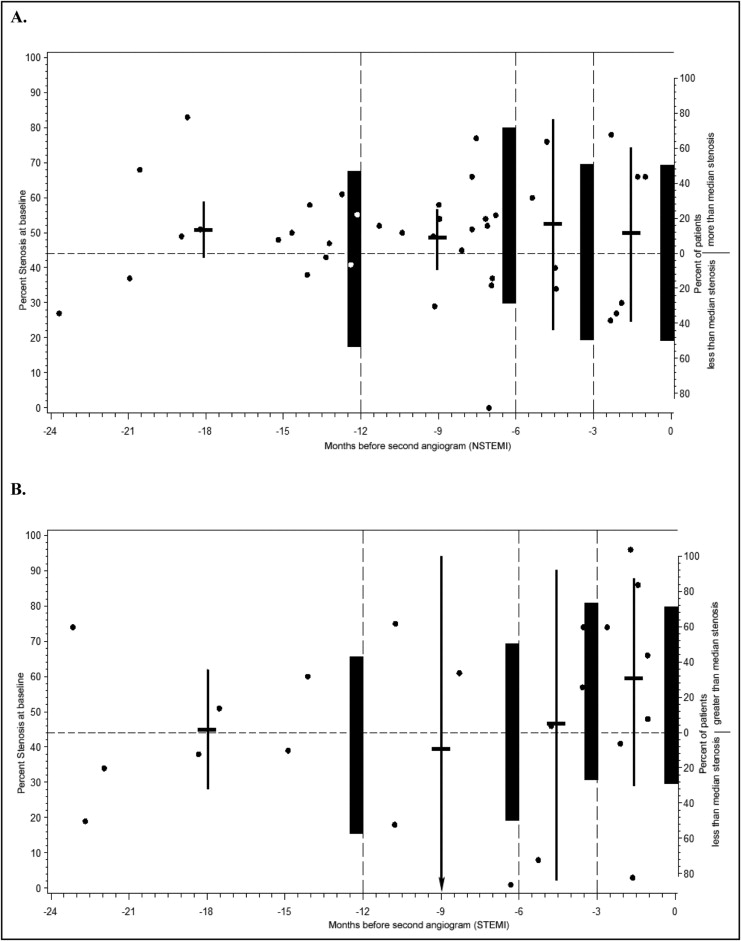
As shown in Figure 1 , in baseline severity, lesions were normally distributed in patients with NSTEMI but had a multimodal distribution in patients with STEMI. Figure 2 shows the severity of baseline lesions and the proportion of lesions above and below the overall median stenosis (of 44%) plotted against interval. Severity of stenosis and the proportion of lesions above the median increased as proximity to the STEMI event increased, but was not the same for patients with NSTEMI.
Stay updated, free articles. Join our Telegram channel

Full access? Get Clinical Tree


