Compost
White-collar workers (controls)
Current workers
Former workers
n
140
49
29
Gender, male (n%)
135 (97 %)
44 (92 %)
28 (97 %)
Age (year; mean ± SD)
45 ± 9.1
51 ± 10.3
57 ± 6.5
sx1-pos (atopics) (n%)
48 (34.5 %)
18 (36.7 %)
5 (17.2 %)
Current smokers (n%)
48 (35 %)
14 (29 %)
5 (17 %)
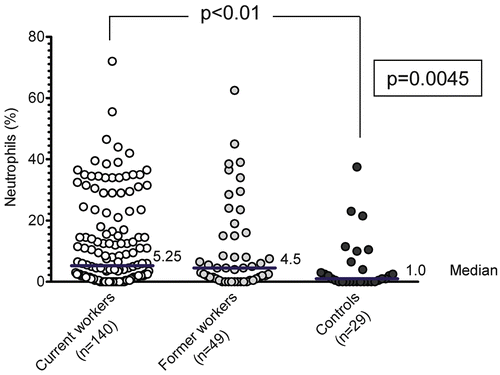
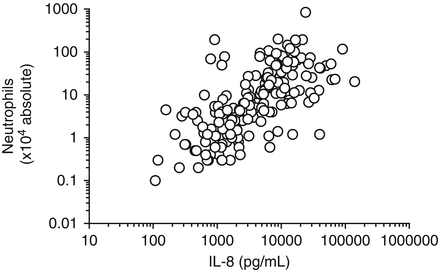
Table 2 summarizes the results of soluble biomarkers measured in IS samples. No significant differences were detected for total protein, IL-8, and immunoreactive MMP-9 concentrations in IS of the current and former compost workers as well as of the white-collar workers. In contrast, differences between the following soluble IS biomarkers were statistically significant: sCD14 (p = 0.0008) and 8-isoprostane (p < 0.0001), especially when comparing with the white-collar worker group. The concentrations of all these biomarkers were lower in IS of the former compost workers compared with the current compost workers, without reaching the statistically significant level. The total cell count showed lower values in the former compost workers than in the current ones (median: 6 × 10⁵ vs. 11 × 105, p = 0.001) and in white collar-workers (p < 0.01) (data not shown). The percentage of neutrophils was significantly higher in the current workers compared with the white-collar workers (p < 0.01) (Fig. 1). Additionally, there was a high correlation between the IL-8 concentration and the number of neutrophils in IS (rs = 0.669; p < 0.0001) (Fig. 2).


Table 2
Comparison of current and former compost workers with the white-collar workers (controls)
Parameter | Compost | White-collar workers | ||||||||
|---|---|---|---|---|---|---|---|---|---|---|
Current workers (I) | Former workers (II) | Controls (III) | ||||||||
n | Median | Interquartile range | n | Median | Interquartile range | n | Median | Interquartile range | ||
Total protein (μg/ml) | 140 | 270 | (121–564) | 49 | 207 | (96–620) | 29 | 355 | (224–642) | n.s. |
IL-8 (pg/ml) | 139 | 3,266 | (1,034–9,991) | 49 | 2,044 | (1,031–6,930) | 29 | 1,889 | (1,012–5,279) | n.s. |
MMP-9 (ng/ml) | 122 | 270 | (109–673) | 48 | 138 | (42–468) | 27 | 295 | (137–394) | n.s. |
sCD14 (pg/ml) | 122 | 6,122 | (1,265–10,859) | 45 | 2,378 | (212–9,949) | 24 | 8,546 | (6,965–14,546) | p = 0.0008 |
I vs. III | ||||||||||
p < 0.05 | ||||||||||
II vs. III | ||||||||||
p < 0.001 | ||||||||||
8-Isoprostane (pg/ml) | 128 | 3,346 | (1,730–5,976) | 44 | 2,297 | (1,086–5,953) | 18 | 14,699 | (7,575–26,032) | p < 0.0001 |
I vs. III | ||||||||||
p < 0.001 | ||||||||||
II vs. III | ||||||||||
p < 0.001 | ||||||||||

Fig. 1
Percentage of neutrophils in induced sputum of current compost workers, former compost workers, and white-collar workers (controls). Using Kruskal-Wallis test with Gaussian approximation the p-value between all three groups is 0.0045 and a significant difference exists between the percentage of IS neutrophils in current workers compared with white-collar workers

Fig. 2
Correlation between IL-8-concentrations and neutrophils in induced sputum. Spearman’s r = 0.669, p < 0.0001
Classification of the subjects according to their smoking habits into current smokers and non-smokers (including also ex-smokers) (Table 3) demonstrated that IS concentrations of several soluble biomarkers are highly influenced by smoking. Non/ex-smokers in the group of former workers showed lower biomarker concentrations compared with the non/ex-smoker group of current workers. Especially the comparison of MMP-9 and sCD14 concentrations in IS samples of these two groups reached the statistically significant level (MMP-9: p < 0.001; sCD14: p < 0.05). Smokers in the group of current workers and former workers showed the highest IL-8 concentrations (Fig. 3). Therefore, for further biomarker analysis smoking habits were taken into account.
Table 3
Comparison of current and former compost workers with the white-collar workers (controls)
Parameter | Compost | White-collar workers | p-value | ||||
|---|---|---|---|---|---|---|---|
Current workers (I) | Former workers (II) | Controls (III) | |||||
A | B | C | D | E | F | ||
Non/Ex-Smoker (n = 91) | Smoker (n = 48) | Non/Ex-Smoker (n = 35) | Smoker (n = 14) | Non/Ex-Smoker (n = 24) | Smoker (n = 5) | ||
Total protein (μg/ml) | 231 | 349 | 155 | 634 | 377 | 260 | p < 0.0001 |
C vs. D p < 0.0001 | |||||||
(102–521) | (142–653) | (69–249) | (505–925) | (222–561) | (232–844) | ||
C vs. E p < 0.05 | |||||||
IL-8 (pg/ml) | 2,746 | 6,959 | 1,217 | 8,267 | 1,893 | 1,574 | p < 0.0001 |
(879–7,701) | (1,475–13,286) | (696–3,002) | (5,048–38,914) | (934–5,185) | (980–24,626) | C vs. D p < 0.001 | |
MMP-9 (ng/ml) | 298 | 265 | 80.6 | 421 | 295 | 231 | p = 0.0029 |
(120–724) | (106–620) | (18.6–202) | (263–1,088) | (212–396) | (100–363) | A vs. C p < 0.001 | |
C vs. D p < 0.001 | |||||||
sCD14 (pg/ml)
Stay updated, free articles. Join our Telegram channel
Full access? Get Clinical Tree
 Get Clinical Tree app for offline access

| |||||||