Median
LQ
UQ
Median
LQ
UQ
p
CAP ( n = 226 )
Control ( n = 84 )
0.88
0.64
1.30
0.33
0.20
0.46
<0.01
Hyponatremia ( n = 91 )
Non-hyponatremia ( n = 209 )
0.83
0.57
1.17
0.69
0.37
1.04
0.019
Table 2
Odds ratios (OR) with 95 % confidence intervals (CI) for copeptin-pneumonia and copeptin-hyponatremia associations
OR | 95 % CI | p | |
|---|---|---|---|
Copeptin – pneumonia | 2.31 | 9.6–55.7 | <0.01 |
Copeptin – hyponatremia | 2.43 | 1.28–4.63 | <0.01 |
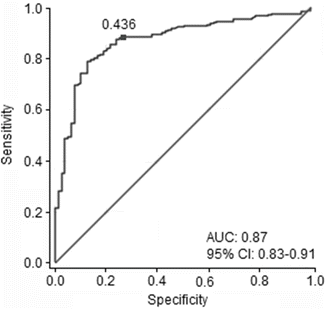
The ROC curve analysis showed the optimal cut-off point for plasma copeptin level in predicting pneumonia to be 0.436 ng/mL. The area under curve (AUC) value of 0.87 (95 % CI: 0.83–0.91) showed that copeptin may be treated as a possible biomarker of pneumonia, characterized by high sensitivity (89 %) and satisfying specificity (73 %), with a positive predictive value of 91 % and a negative predictive value of 69 % (Fig. 1).


Fig. 1
Plasma copeptin level – pneumonia in receiver operating characteristic curve analysis
The analysis of copeptin levels showed no correlation between copeptin and any of the markers of disease severity (laboratory or clinical). Patients with increased copeptin concentration (above median) tended to have higher body temperature (OR 1.9, 95 % CI: 1.1–3.3, p = 0.02), but there was no correlation between copeptin and body temperature in Spearmann’s correlation rank or in ROC analysis.
The copeptin level was higher in the children with lowered sodium levels than in those with normal sodium level (0.83 ng/mL, IQR: 0.57–1.17 vs. 0.69 ng/mL, IQR: 0.37–1.04; p = 0.019) (Table 1). Multivariate logit analysis showed that patients with higher copeptin concentration (above median) were at over twofold higher risk of developing hyponatremia (OR 2.43, 95 % CI: 1.28–4.63, p < 0.01), although ROC analysis showed no acceptable cut-off point value.
There was a weak reverse correlation between the sodium and copeptin concentrations (Spearmann’s rank coefficient = −0.19), but it was relevant only in the normonatremic patient subgroup (Spearmann’s rank coefficient = −0.16), while it was insignificant in the children with lowered sodium levels (Table 3). We found no statistically significant Spearmann’s correlation rank coefficient in the group with pneumonia or in the healthy children.
Table 3
Spearmann’s coefficient rank for sodium – copeptin correlation
Total | −0.19 |
Hyponatremia | NS |
Non-hyponatremia | −0.16 |
CAP | NS |
Control | NS |
4 Discussion
The aim of this study was to assess the usefulness of copeptin in pediatric patients with pneumonia. To our knowledge, this is the first report on the sodium-copeptin relationship in children and, to-date, a second one on copeptin in the assessment of pneumonia severity. Copeptin may be helpful in differentiating patients with pneumonia. In a unique study on the subject by Du et al. (2013) median copeptin levels were much higher in children with pneumonia compared with healthy volunteers, and in that area the present study confirmed those data. We consider copeptin to be a potential valuable marker for making clinical diagnosis of pneumonia with sensitivity nearly 90 % and AUC 0.87. Nevertheless, further confirmatory studies are required, in particular research focusing on differences in copeptin levels in patients with pneumonia and other respiratory tract infections, e.g., upper-respiratory tract infection or bronchitis, would make a large contribution to our knowledge on the usefulness of copeptin in CAP.
< div class='tao-gold-member'>
Only gold members can continue reading. Log In or Register to continue
Stay updated, free articles. Join our Telegram channel

Full access? Get Clinical Tree


