Figure 97.2 Software results: The top panel represents the three-dimensional modeled right ventricle. The lower panel represents the time–volume curve. The end diastolic and systolic volumes are used to calculate the stroke volume and ejection fraction.
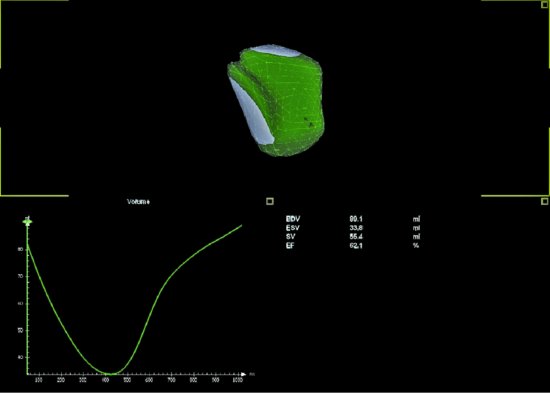
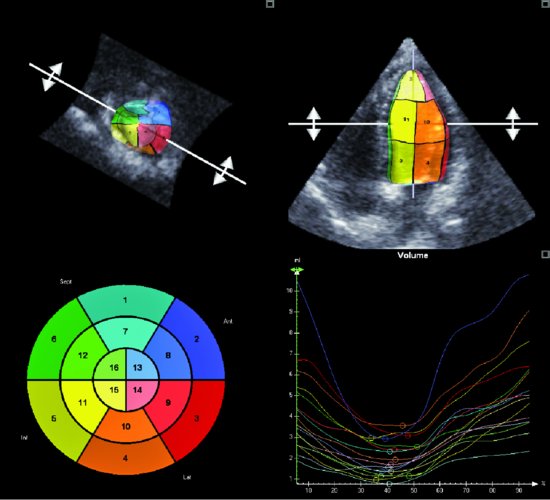
Figure 97.3 Three-dimensional echocardiography for left ventricular global and regional systolic function. The regional volume is divided in to 16-segment model (bottom left). Right lower image is the time–volume (or ejection fraction) curves (change in volume) for each individual left ventricular volume segment.
LV volume can be measured by GE 4D Auto LVQ tool (4DLVQ). This is a new volume quantification tool for rapid semi-automated detection of the LV endocardial border in real time 3D images.
Stay updated, free articles. Join our Telegram channel

Full access? Get Clinical Tree


