This study was designed to determine the ability and reliability of 3-dimensional (3D) transesophageal echocardiography (TEE) to assess the geometry and size of the left atrial appendage (LAA). Three-dimensional TEE may allow more accurate assessment of, and provide additional information on, LAA morphology compared to 2-dimensional TEE. Validation studies for LAA morphology data derived from 3D TEE were performed using 10 isolated porcine LAA specimens. Of 107 enrolled patients, 55 patients were in sinus rhythm (normal sinus rhythm), in whom 3D transesophageal echocardiographic images were obtained from full-volume mode imaging, and in 52 patients with atrial fibrillation, zoom-mode imaging was used. LAA orifice area, depth, and volume and the number of LAA lobes were assessed on reconstructed 3D imaging. Left atrial volume was calculated using 2-dimensional echocardiographic imaging. In experimental studies, excellent correlations (r >0.90, p <0.001) between the measurements by full-volume or zoom-mode imaging and reference data were observed in all parameters. The mean LAA orifice long diameter was 29.7 ± 7.4 mm, the mean short diameter was 20.6 ± 5.9 mm, the mean orifice area was 5.1 ± 2.5 cm 2 , the mean LAA depth was 38.5 ± 8.2 mm, and the mean volume was 9.2 ± 5.6 ml. The most frequent number of LAA lobes was 2 (n = 52), followed by 3 (n = 28), 1 (n = 18), and 4 (n = 3). Left atrial volume was weakly correlated with LAA orifice long diameter (r = 0.33, p = 0.001), short diameter (r = 0.40, p <0.001), area (r = 0.39, p <0.001), LAA depth (r = 0.21, p = 0.03), and volume (r = 0.36, p = 0.001). In conclusion, 3D TEE is a reliable modality to evaluate LAA geometry and provides detailed information to quantify varied LAA characteristics.
As an intracardiac source of emboli, the left atrial appendage (LAA) is a critical site of thrombus formation. Two-dimensional (2D) transesophageal echocardiography (TEE) has been widely used to characterize LAA structure and evaluate LAA function. Pathologic specimens of the LAA display its complex and extremely variable geometry. Now, three-dimensional (3D) TEE can provide unique views using a pyramidal ultrasound beam and slice the image in any plane to enable the visualization of any or all cardiac structures from multiple vantage points. The initial study with 3D TEE showed its potential to assess LAA morphology more accurately compared to 2D TEE. However, detailed LAA morphology has not been fully examined using 3D TEE. Therefore, this study was designed to determine the ability of 3D TEE to assess the geometry and size of the LAA.
Methods
Three-dimensional data sets of LAA morphology in 3D transesophageal echocardiographic examinations were validated using 10 isolated LAA specimens obtained from edible porcine hearts. The LAA reference volume was determined by measuring the volume of saline required to fill each LAA specimen. Reference long and short diameters of the LAA orifice were measured as the maximum and minimum lengths of the orifice. LAA depth was measured as the maximum length from the orifice to the leading edge of the lobes, and LAA orifice area was also measured using software (Scion Image; Scion Corporation, Frederick, Maryland). All data were measured by an observer (YS) who was blinded to the 3D transesophageal echocardiographic data. Each LAA was suspended and placed into a water tank filled with deaerated saline. The distance from transesophageal echocardiographic probe placed in the tank to porcine LAA specimens was set to approximately 5 cm. Three-dimensional images were obtained for each LAA via full-volume mode and zoom-mode examinations, and the long and short diameters of the LAA orifice, depth, orifice area, and LAA volume were each measured by an observer (HN) who was blinded to the reference data. Details of the method are summarized later.
One hundred seven consecutive patients ultimately found not to have LAA thrombi were studied during clinically indicated TEE to assess the presence of LAA thrombi at Tsukuba University Hospital. LAA thrombi were assessed using a real-time 3D transesophageal mode that can visualize 2 orthogonal images simultaneously (X-plane mode). Informed consent was obtained at the time of consent for clinical TEE.
Standard 2D transthoracic echocardiographic examinations were performed using an iE33 ultrasound system and an S5-2 probe (Philips Medical Systems, Andover, Massachusetts). The left ventricular end-diastolic and end-systolic diameters were measured on an M-mode image derived from an left ventricular short-axis view at the chordal level. Left ventricular end-diastolic and end-systolic volume and the left ventricular ejection fraction were measured using a modified Simpson’s method. End-systolic and end-diastolic left atrial volumes were measured using a modified Simpson’s method in the apical 4- and 2-chamber views.
Three-dimensional TEE was performed using an iE33 ultrasound system with an S7-2 probe (Philips Medical Systems). LAA emptying flow velocity was measured in the basal short-axis view from the transverse scan (45° views). The LAA emptying flow velocity was measured as the average of 3 consecutive cardiac cycles in patients in normal sinus rhythm (NSR) and 5 consecutive cardiac cycles in patients with atrial fibrillation (AF). Full-volume mode examinations were performed from 45° views during apnea at end-expiration. To obtain these data sets, 6 sectors were scanned with gating to the electrocardiographic R wave and were automatically integrated into a wide-angle (76° × 69°) pyramidal data image covering the entire LAA. The frame rate of each image was set at approximately 20 to 30 frames/s. In patients with AF during the examination, zoom mode, which magnified the pyramidal scan by 1 cardiac beat, was used. The range of pyramidal scan was carefully regulated to include the entire LAA. The frame rate of each image was set at approximately 10 frames/s.
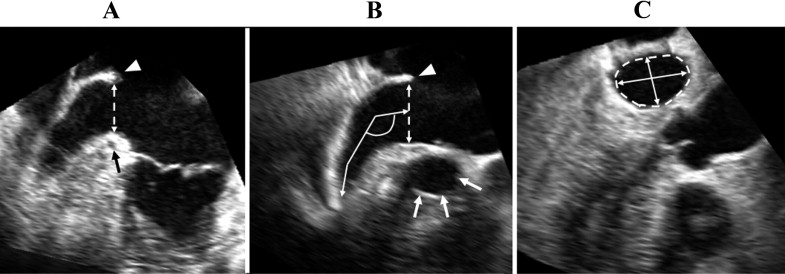
Quantification of LAA morphology was performed using QLAB GI-3DQ software (Philips Medical Systems). First, multireconstruction planes of the LAA were obtained from 3D data sets (pyramidal images) including the LAA at the end-systole. In the long-axis view ( Figure 1 ), the LAA orifice was determined by 2 lines, one connected between the vestibule of the mitral valve annulus near the left coronary artery and the lateral ridge of the left superior pulmonary vein and the other between a point near the aortic valve annulus and the lateral ridge of the left superior pulmonary vein. We measured the LAA orifice long and short diameters and orifice area at left ventricular end-systole and end-diastole ( Figure 1 ). The LAA depth of the orifice to a lobe tip and the angle of the first bend from the center of the LAA orifice on the center line to measure the LAA depth were measured at left ventricular end-systole. LAA volume was measured at left ventricular end-systole on a reconstructed image as follows: the inner border of the LAA was manually traced within the distal area of the orifice, and the transverse images of the longest axis of the LAA trace area were automatically sliced at 10 levels from the orifice to the most distal site. On each sliced transverse image, the inner border was manually traced and reconstructed into a 3D image. On a reconstructed image, we measured LAA volume, and the number of LAA lobes was assessed on the basis of the definition by Veinot et al : (1) LAA lobe was a visible out-pouching from the main tubular body of the LAA, usually demarcated by an external crease; (2) it was internally capable of admitting a 2-mm probe (i.e., it was not simply a tag of external adipose tissue); (3) it was occasionally but not necessarily associated with a change in direction of the main tubular body of the LAA; (4) it could lie in a different anatomic plane than the main tubular body; and (5) by definition, the LAA must have ≥1 lobe ( Figure 2 ).

Twenty studies were selected for the assessment of intra- and interobserver reproducibility of LAA volume measurements by 3D TEE. Because different methods of acquiring 3D data sets were used between patients in NSR and those with AF, we studied 10 patients in NSR and 10 with AF. In all measurements, 2 observers independently obtained multiplanar reconstructed images to assess LAA morphology from pyramidal 3D data sets. To test intraobserver variability, a single observer (HN) analyzed the data twice on occasions separated by an interval of 1 month. To test interobserver variability, a second observer analyzed the data without knowledge of the first observer’s measurements. Reproducibility was assessed as the mean percentage error (absolute difference divided by the mean of the 2 observations).
Results are expressed as number (percentage) or as mean ± SD. Comparisons of continuous variables between groups were performed using Student’s t tests. Correlations between 2 variables were evaluated by linear regression analysis. Correlations between left atrial volume and the number of LAA lobes were evaluated using Pearson’s rank correlation coefficient. A p value <0.05 was considered to indicate statistical significance. All calculations were performed using SPSS for Windows (SPSS, Inc., Chicago, Illinois).
Results
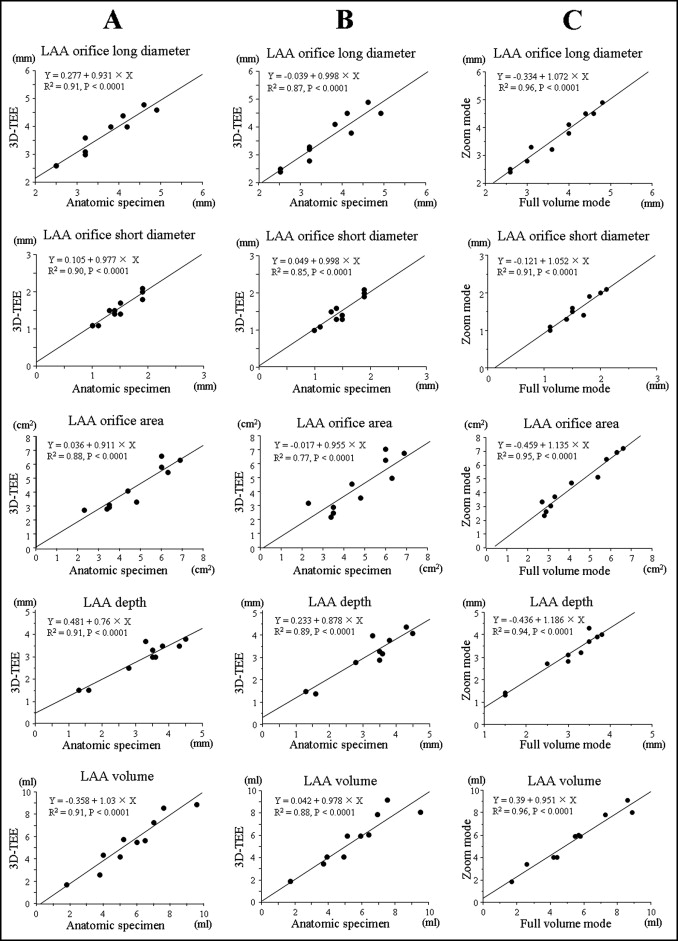
Comparisons between the measurements in full-volume mode and zoom mode by 3D TEE and reference data are shown in Figure 3 . Excellent correlations were observed between echocardiographic data and reference data for each 3D transesophageal echocardiographic mode.
All 107 patients underwent TEE without complications. Clinical characteristics and 2D transthoracic echocardiographic data are listed in Table 1 . On 3D TEE, LAA morphology could be assessed in 101 patients (94%). The remaining 6 patients, who all had AF, were excluded because of poor image quality for analysis. The clinical and echocardiographic data for the 6 excluded patients are listed in Table 2 . Compared with included patients with AF, heart rates were faster in the excluded patients, and all patients with heart rates ≥90 beats/min (patients 1, 3, 5, and 6) were excluded.
| Variable | Value |
|---|---|
| Men/women | 81/26 |
| Age (years) | 61 ± 11 (27–82) |
| Heart rate (beats/min) | 68 ± 14 (48–94) |
| Co-morbidities | |
| Paroxysmal atrial fibrillation | 44 (41%) |
| Chronic atrial fibrillation | 37 (35%) |
| Mitral regurgitation | 8 (7%) |
| Mitral valve stenosis | 4 (4%) |
| Aortic valve stenosis | 2 (2%) |
| Cardiomyopathy | 10 (9%) |
| Primary cardiac angiosarcoma | 1 (1%) |
| Metastatic cardiac tumor | 1 (1%) |
| Rhythm at examination | |
| Normal sinus rhythm | 55 (51%) |
| Atrial fibrillation | 52 (49%) |
| Measurements on 2D transthoracic echocardiography | |
| Left ventricular end-diastolic diameter (mm) | 50 ± 6 (31–70) |
| Left ventricular end-systolic diameter (mm) | 33 ± 7 (21–63) |
| Left ventricular end-diastolic volume (ml) | 108 ± 30 (38–202) |
| Left ventricular end-systolic volume (ml) | 41 ± 21 (16–161) |
| Left ventricular ejection fraction (%) | 62 ± 12 (20–82) |
| Left atrial volume (ml) | 74 ± 44 (20–273) |
| Left atrial appendage emptying flow velocity (cm/s) | 41 ± 19 (5–89) |
| Patient | Gender | Age (years) | Heart Rate (beats/min) | Left Ventricular Ejection Fraction (%) | Left Atrial Volume (ml) | LAA Flow (cm/s) |
|---|---|---|---|---|---|---|
| Included patients with AF (n = 46) | 39 male, 7 female | 62 ± 10 | 65 ± 10 | 57 ± 13 | 92.9 ± 51.7 | 37.6 ± 19.7 |
| Excluded patients (n = 6) | 52 ± 17 | 77 ± 17 ⁎ | 69 ± 7 ⁎ | 83.9 ± 41.1 | 45.7 ± 6.6 | |
| 1 | Female | 64 | 90 | 73 | 101.3 | 46.8 |
| 2 | Male | 32 | 61 | 67 | 67.5 | 51.6 |
| 3 | Male | 73 | 90 | 68 | 45.2 | 38.3 |
| 4 | Male | 43 | 58 | 62 | 56.8 | 53.7 |
| 5 | Female | 74 | 94 | 76 | 163.3 | 38.2 |
| 6 | Male | 41 | 92 | 79 | 99.7 | 41.1 |
Comparisons of left atrial and LAA data between patients in NSR and those with AF are listed in Table 3 . In patients with AF, left atrial and LAA volumes and LAA orifice measurements were larger than in patients in NSR. In patients in NSR and in those with AF, left atrial volume and LAA orifice measurements at end-diastole were significantly decreased compared to those at end-systole. The number of LAA lobes ranged from 1 to 4, and a representative case of each is shown in Figure 4 . In patients in NSR, 2 lobes were observed most frequently (n = 30), followed by 1 lobe in 14 patients, 3 lobes in 10 patients, and 4 lobes in 1 patient. In patients with AF as well, patients with 2 lobes were observed most frequently (n = 22), followed by 3 lobes in 18 patients, 1 lobe in 4 patients, and 4 lobes in 2 patients.
Stay updated, free articles. Join our Telegram channel

Full access? Get Clinical Tree


