Chapter 22 Anaesthesia
 All anaesthetic drugs reduce ventilation and impair the ventilatory response to both hypercapnia and hypoxia.


Only 12 years after the first successful public demonstration of general anaesthesia in 1846, John Snow reported the pronounced changes that occur in respiration during the inhalation of chloroform.1 Subsequent observations have confirmed that anaesthesia has profound effects on the respiratory system. However, these effects are diverse and highly specific, some aspects of respiratory function being profoundly modified while others are scarcely affected at all.
Control of Breathing2
Unstimulated Ventilation
There are anaesthetists in many parts of the world who do not believe that temporary hypercapnia during anaesthesia is harmful to a healthy patient. Many hundreds of millions of patients must have been subjected to this transient physiological trespass since 1846 and there seems to be no convincing evidence of harm resulting from it – except perhaps increased surgical bleeding. In other parts of the world the departure from physiological normality is regarded with concern and it is usual either to assist spontaneous respiration by manual compression of the reservoir bag or, more commonly, to paralyse and ventilate artificially as a routine.
Effect on Pco2/Ventilation Response Curve
Progressive increases in the alveolar concentration of all inhalational anaesthetic agents decrease the slope of the Pco2/ventilation response curve and, at deep levels of anaesthesia, there may be no response at all to Pco2. Furthermore, the anaesthetised patient, as opposed to the awake subject, always becomes apnoeic if the Pco2 is reduced below this intercept, which is known as the apnoeic threshold Pco2 (page 70). In Figure 22.1, the flat curve rising to the left represents the starting points for various Pco2/ventilation response curves. Without added carbon dioxide in the inspired gas, deepening anaesthesia is associated with a decreasing ventilation and a rising Pco2, points moving progressively down and to the right. At intervals along this curve are shown Pco2/ventilation response curves resulting from adding carbon dioxide to the inspired gas.
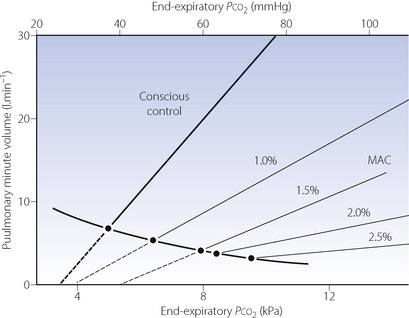
Fig. 22.1 Displacement of the Pco2/ventilation response curve with different end-expiratory concentrations of halothane. The curve sloping down to the right indicates the pathway of Pco2 and ventilation change resulting from depression without the challenge of exogenous carbon dioxide. The broken lines indicate extrapolation to apnoeic threshold Pco2. MAC; minimum alveolar concentration. The curves have been constructed from the data of reference 3.
At equivalent depth of anaesthesia, currently available inhaled anaesthetics depress the ventilatory response to Pco2 by a similar amount. This is conveniently shown by plotting the slope of the Pco2/ventilation response curve against equi-anaesthetic concentrations of different anaesthetics (Figure 22.2), shown as multiples of minimum alveolar concentration (MAC), although the validity of using MAC multiples in this way has been questioned. The currently used halogenated agents do not differ greatly from one another but diethyl ether is exceptional in having little effect up to 1 MAC. With low doses of inhaled anaesthetics (= 0.2 MAC) there is almost no depression of the hypercapnic ventilatory response,4 in contrast to the response to hypoxia described below.
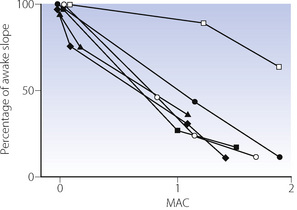
 , halothane;
  , enflurane;
  , isoflurane; ♦, sevoflurane;
  , desflurane;
  , diethylether.
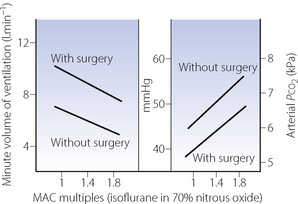
Surgical stimulation antagonises the effect of anaesthesia on the Pco2/ventilation response curve (Figure 22.3). It may easily be observed that in a spontaneously breathing patient a surgical incision increases the ventilation whatever the depth of anaesthesia. During prolonged anaesthesia without surgical stimulation, there is no progressive change in the response curve up to 3 hours. With the exception of ketamine, intravenous anaesthetics have similar effects on ventilation to the inhalational anaesthetics.
Effect on Po2/Ventilation Response Curve9,10
The normal relationship between Po2 and ventilation has been described on pages 71 et seq. It was long believed that this reflex was the ultima moriens and, unlike the Pco2/ventilation response curve, unaffected by anaesthesia. This doctrine was a source of comfort to many generations of anaesthetists in the past. Little attention was given to the observation of Gordh in 1945 that ether anaesthesia nearly abolished the ventilatory response to hypoxaemia while the response to carbon dioxide was still present.11
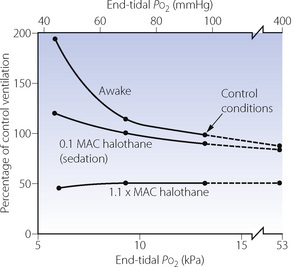
Over 30 years later, halothane anaesthesia was shown to reduce the acute hypoxic ventilatory response (AHVR) in humans.12 Shortly afterwards in 1978, Knill & Gelb13 showed that not only was the hypoxic response affected by inhalational anaesthetics but it was also, in fact, exquisitely sensitive (Figure 22.4). Hypoxic drive was markedly attenuated at 0.1 MAC, a level of anaesthesia that would not be reached for a considerable time during recovery from anaesthesia. Similar effects were found with all the currently used inhalational agents,9 and with the intravenous anaesthetic propofol.14
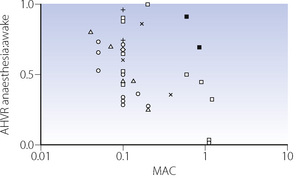
These findings were widely accepted for some years, until a study by Temp et al15 in 1992 showed that AHVR was only diminished in hypercapnic conditions. This study initiated a great deal of further research. A summary of the findings of these and many other studies are shown in Figure 22.5. The most notable feature of these results is their diversity, with, for example, different studies of similar concentrations of isoflurane, particularly at sedative levels, resulting in completely opposite results. However, for the other agents there does seem to be a generally dose-dependent depression of the hypoxic ventilatory response, though at 0.1 MAC considerable variation remains. There are many possible explanations for these results, mostly relating to methodological differences between studies:
 ], halothane; [
 ], enflurane; [
 ], isoflurane; [
 ], sevoflurane; [×], nitrous oxide; [+], desflurane.
Anaesthetic agent. Differences between anaesthetic agents in their effects on AHVR are not obvious from Figure 22.5. However, a recent quantitative review of 37 studies did find differences, with the least depression of the response by low-dose sevoflurane, progressively increasing depression by isoflurane and enflurane, with halothane having the greatest effect.9
Subject stimulation. The degree of arousal of subjects is known to affect the AHVR. Studies of hypoxic response at ‘sedative’ levels of anaesthesia (0.2 MAC or less) have differed in the amount of stimulation provided, with some forcing the subjects to remain awake15 and others leaving subjects undisturbed. One study comparing awake and asleep subjects with 0.1 MAC isoflurane found no depression of the hypoxic response in the awake group.16 However, the same review described in the previous paragraph did find subject stimulation to be a significant factor in determining the degree of depression of AHVR, and that this effect may be influenced by the specific anaesthetic agent used.9
Hypoxic challenge. The rate of onset, degree and duration of hypoxia will all affect the ventilatory response, which is normally biphasic with hypoxic ventilatory decline (HVD) occurring a few minutes after the onset of hypoxia (see Figure 5.6). Some studies used rapid ‘step’ changes into hypoxic conditions,17 whilst others used a ‘ramp’ onset of hypoxia over 8–10 min.18 In the latter situation, the response under study will be a combination of AHVR and HVD.15 These differences do not seem to be of practical importance. One study addressing different patterns of hypoxic onset on AHVR found no difference between the two,19 and a recent review did not find the hypoxic stimulus to be a major factor.9 Hypoxic ventilatory decline seems to be uninfluenced by anaesthesia.15,20
Subject selection. The magnitude of the AHVR differs greatly between individuals (page 72). Some studies have been performed using only subjects found to have a ‘brisk’ ventilatory response to hypoxia,17 and these results cannot therefore be extrapolated to a broader range of patients.
Carbon dioxide concentration may be maintained at normal, pre-hypoxic, levels (isocapnia) or allowed to find its own level (poikilocapnia). This has a large effect in the awake subject, with the hypoxic response being greatly attenuated during poikilocapnia (see Figure 5.6). During anaesthesia with up to 0.85 MAC isoflurane, the hypoxic ventilatory response during poikilocapnia is essentially maintained;21 that is, the increase in ventilation with hypoxic challenge is the same when asleep as when awake. This has led to the suggestion that anaesthesia has less effect on the hypoxic ventilatory response itself, but may reduce the normally additive interaction between the ventilatory responses to hypoxia and hypercapnia (see Figure 5.7).15,21
It is generally agreed that the effect of anaesthetics on AHVR is on the peripheral chemoreceptors, possibly exclusively so at sedative levels.22 Anaesthesia also impairs the ventilatory response to doxapram, which acts on the peripheral chemo-receptors (page 78).13
Implications of the Depression of AHVR by Anaesthetic Agents
There are four important practical implications of the attenuation of AHVR by anaesthesia:
Recent uncertainty about the effect of subanaesthetic concentrations on AHVR has cast doubt on the validity of extrapolating the results of earlier studies to patients recovering from anaesthesia. The degree of stimulation of the patient is likely to affect their AHVR response, which will therefore be affected by many factors such as pain control and the amount of activity in their surroundings. A patient should behave like a poikilocapnic subject, and so depression of AHVR will be minimal.9,21 Finally, patients recovering from an anaesthetic will frequently be hypercapnic secondary to opioid administration, sometimes compounded by airway obstruction. Under these circumstances the ventilatory response to the combination of hypoxia and hypercapnia is almost certainly reduced to less than that seen when awake.
There is little doubt that more research is needed to understand the complex effects of anaesthesia on ventilatory responses.9,10,23 Though recent work may have cast some doubt on the earlier studies of Knill et al13 (Figure 22.4), there remains plenty of evidence that a sleeping patient in the recovery room is at risk of failing to mount a suitable ventilatory response to hypoxia.
Pattern of Contraction of Respiratory Muscles
The Pharynx
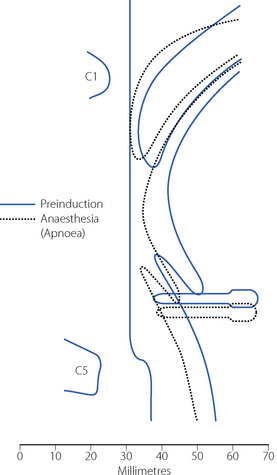
Anaesthesia usually causes obstruction of the pharyngeal airway unless measures are taken for its protection. Figure 22.6 shows changes in the sagittal geometry of the pharynx immediately after induction of anaesthesia with thiopentone in the supine position.24 The soft palate falls against the posterior pharyngeal wall, occluding the nasopharynx in almost every patient, presumably due to interference with the action of some or all of tensor palati, palatoglossus or palatopharyngeus (page 83). Similar findings are also reported using magnetic resonance imaging, when the mean anteroposterior diameter of the pharynx at the level of the soft palate decreased from 6.6 mm when awake to 2.7 mm during propofol anaesthesia.25 Radiographic studies have shown considerable posterior movement of tongue and epiglottis, but usually not sufficient to occlude the oral or hypopharyngeal airway (Figure 22.6). In animals, there is marked interference with genioglossus activity during anaesthesia,26 and human observations have shown that thiopentone decreases the electromyographic (EMG) activity of genioglossus and the strap muscles.27 Nevertheless, Nandi et al24 showed that the posterior movement of the palate was not caused by pressure from the tongue.
(Reproduced from reference 24 by permission of the Editor of the British Journal of Anaesthesia and Oxford University Press.)
Secondary changes occur when the patient attempts to breathe. Upstream obstruction then often causes major passive downstream collapse of the entire pharynx (Figure 22.7), a mechanism with features in common with the sleep apnoea hypo-pnoea syndrome (page 271). This secondary collapse of the pharynx is due to interference with the normal action of pharyngeal dilator muscles, particularly genioglossus. The epiglottis may be involved in hypopharyngeal obstruction during anaesthesia,28 and posterior movement is clearly seen in Figures 22.6 and 22.7.
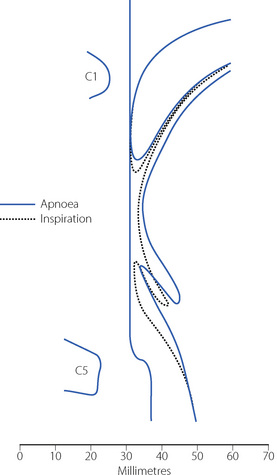
Fig. 22.7 Median sagittal section of the pharynx during anaesthesia to show changes between the apnoeic state (continuous lines, corresponding to the broken lines in Figure 22.6) and following attempted inspiration (broken lines). Upstream obstruction in the nasopharynx results in downstream collapse of the oro- and hypopharynx.
(Reproduced from reference 24 by permission of the Editor of the British Journal of Anaesthesia and Oxford University Press.)
Protection of the pharyngeal airway. Extension of the neck moves the origin of genioglossus anteriorly by 1–2 cm and usually clears the hypopharyngeal airway.29 Protrusion of the mandible, originally proposed by Heiberg in 1874,30 moves the origin of genioglossus still further forward. The use of a pharyngeal airway, such as that of Guedel, is frequently helpful, but the tip may become lodged in the valecula, or the tongue may be pushed downwards and backwards to obstruct the tip of the airway.31 Developed by Brain in 1983,32 the laryngeal mask airway provides an airtight seal around the laryngeal perimeter allowing spontaneous ventilation. Use of a laryngeal mask does not prevent regurgitated gastric contents gaining access to the larynx, and with high airway pressures inspired gas may pass into the oesophagus or stomach during intermittent positive pressure ventilation (IPPV). For the most reliable maintenance of airway patency a tracheal tube is used, which requires the use of either ‘deep’ anaesthesia or muscle relaxants.
The Inspiratory Muscles2
John Snow’s early observations of respiration during anaesthesia describe that a decrease in thoracic respiratory excursion may be used as a sign of deepening anaesthesia. The effect was first quantified by Miller in 192533 and more precisely related to depth of anaesthesia with halothane in 1979.34 Selective depression of some inspiratory ribcage muscles does occur. Electromyography of the para-sternal intercostal muscles in humans shows their activity to be consistently abolished by 1 MAC of anaesthesia, and absent in some subjects at just 0.2 MAC.35,36 Thiopentone decreases the EMG activity of sternothyroid, sternohyoid and the scalene muscles.27 In contrast, diaphragmatic function seems to be well preserved during anaesthesia, particularly phasic EMG activity during inspiration. This combination of changes in muscle activity commonly gives rise to paradoxical inspiratory movements whereby diaphragmatic contraction causes expansion of the lower ribcage and abdomen whilst the upper ribcage is drawn in due to the negative intrathoracic pressure and a lack of support from upper ribcage respiratory muscles. This pattern of breathing is seen commonly in children, who have a more compliant chest wall than adults, and in adults when respiratory resistance is increased causing a greater fall in intrathoracic pressure. Some studies have, however, found no reduction in ribcage movement with, for example, isoflurane at 1 MAC37 or ketamine.38 It is possible that changes in spinal curvature during anaesthesia have caused earlier studies of ribcage movement to overestimate the changes.35,39 Also, spontaneous ventilation via a tracheal tube is associated with greater airway resistance than other methods such as a laryngeal mask, which may contribute to less ribcage expansion during anaesthesia.40 Thus earlier descriptions of selective depression of ribcage movement should not be regarded as an invariable feature of anaesthesia with spontaneous ventilation, particularly at the depth of anaesthesia used clinically and with a low-resistance, unobstructed airway.
The Expiratory Muscles41
General anaesthesia causes expiratory phasic activity of the abdominal muscles, which are normally silent in the conscious supine subject. Anaesthetic agents, opioids and hypercapnia are all involved in stimulating the expiratory muscle activity. This activity begins in some subjects at only 0.2 MAC of halothane,35 and is very difficult to abolish as long as spontaneous breathing continues.42 Activation of expiratory muscles seems to serve no useful purpose and does not appear to have any significant effect on the change in functional residual capacity.43
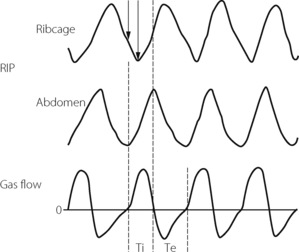
Respiratory muscle co-ordination often becomes disturbed during anaesthesia with spontaneous ventilation.37,40 Paradoxical movements between the upper and lower chest wall, and the chest and abdominal muscles, are accompanied by changes in respiratory timing between inspiratory and expiratory muscle groups. These are believed to originate in selective effects of anaesthesia on different respiratory neuronal groups in the central pattern generator,36 and are more marked when airway resistance is higher.40 The most usual pattern seen is a phase delay between abdominal and ribcage movement as illustrated in Figure 22.8.
Change in Functional Residual Capacity
Bergman in 1963 was the first to report a decrease of functional residual capacity (FRC) during anaesthesia.45 The reduction in FRC is now known to have the following characteristics:43,46,47
 FRC is reduced during anaesthesia with all anaesthetic drugs that have been investigated, by a mean value of about 16–20% of the awake FRC in the supine position. However, there is considerable individual variation and changes range from about +19% to −50%.


The Cause of the Reduction in FRC48
There is general agreement that three factors may contribute to the reduced FRC, as follows.
Chest shape. Earlier studies that measured anteroposterior and lateral diameters, or the circumference, of the external chest wall gave conflicting results regarding changes in internal chest volume with anaesthesia. However, the introduction of fast computed tomography (CT) scanners led to the conclusion that there is a reduction in the cross-sectional area of the rib cage corresponding to a decrease in lung volume of about 200 ml.49,50 A dynamic spatial reconstructor (DSR) technique allows scans of half the chest to be obtained in just 0.3 s, following which a three-dimensional picture of all chest structures can be generated and analysed.35 This has confirmed that changes in chest wall shape account for a reduction in FRC of about 200 ml. There is less agreement about why the chest wall changes shape, possible explanations including the changes in respiratory muscle activity already described, diaphragmatic position and activity, or spinal curvature.
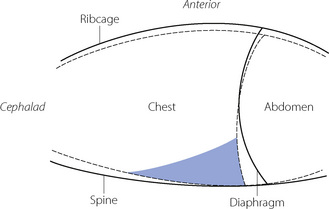
Diaphragm position. In the conscious subject in the supine position there is evidence of residual end-expiratory tone in the diaphragm,51 which prevents the weight of the viscera pushing the diaphragm too far into the chest in the supine position. This diaphragmatic end-expiratory tone may be lost during anaesthesia. Such a change would result in the diaphragm moving cephalad during anaesthesia, which was reported in early studies.50,52 However, other investigators found no consistent cephalad movement of the diaphragm during anaesthesia. Studies using DSR and fast computed tomography have provided good evidence that diaphragm shape alters during anaesthesia.48,53 Although there is a large variation between subjects, these studies have consistently shown a cephalad movement of the dependent regions of the diaphragm, with little or no movement of the non-dependent regions.35 One study found a significantly greater cephalad shift of the diaphragm in patients who were paralysed,53 though this had not been observed in earlier studies. The change in FRC that can be ascribed to changes in diaphragm shape is on average less than 30 ml.35 A summary of the changes in chest wall and diaphragm positions during anaesthesia is shown in Figure 22.9.
Thoracic blood volume. A shift of blood from the peripheral circulation into the chest during anaesthesia has been postulated as a cause of reduced FRC,43 and one CT study seemed to demonstrate this.54 However, this observation has not been confirmed,35,50,55 and is currently regarded as an unlikely contributory factor to the reduced FRC.
Atelectasis During Anaesthesia48
‘Miliary atelectasis’ during anaesthesia was first proposed by Bendixen et al in 1963 as an explanation of the increased alveolar/arterial Po2 difference during anaesthesia.56 Conventional radiography, however, failed to show any appreciable areas of collapse, presumably due to most atelectasis being behind the diaphragm on anteroposterior radiographs (see below). Hedenstierna’s group in Sweden were the first to demonstrate pulmonary opacities on CT scans of subjects during anaesthesia. These opacities usually occurred in the dependent areas of lung just above the diaphragm and were termed ‘compression atelectasis’ (Figure 22.10). Their extent correlated very strongly with the calculated intra-pulmonary shunt, and animal studies showed that the areas of opacity had a typical histological appearance of collapsed lung.55
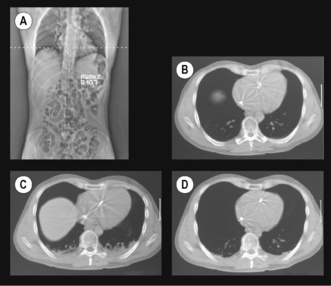
(Scans (A) and (B) are reproduced from reference 57 with the permission of the authors and the editors and publishers of Acta Anesthesiologica Scandanavica. I am indebted to the authors for supplying the other two scans.)
Atelectasis occurs in between 75% and 90% of healthy individuals having general anaesthesia with muscle paralysis.47,58 It occurs more commonly in children59 because of their compliant chest wall, but is unrelated to age in adults. Atelectasis is most easily quantified from a single CT scan slice, taken immediately above the dome of the right diaphragm, and expressed as the percentage of the cross-sectional area containing atelectasis. The percentage of atelectasis during anaesthesia recorded in this way seems small, usually around 3%, but the atelectatic areas contain many more alveoli per unit volume than aerated lung, and this 3% of cross-sectional area equates to around 10% of lung tissue.60
Causes of Atelectasis
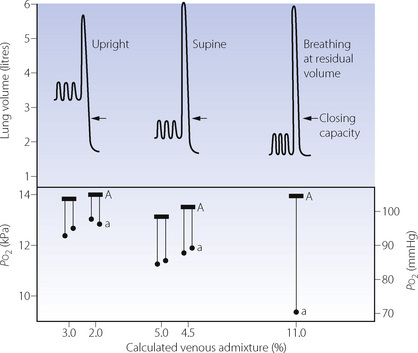
Airway closure as a result of the reduced FRC may lead to atelectasis. In the supine position, the expiratory reserve volume has a mean value of approximately 1 litre in males and 600 ml in females. Therefore, the reduction in FRC following the induction of anaesthesia will bring the lung volume close to residual volume. This will tend to reduce the end-expiratory lung volume below the closing capacity (CC), particularly in older patients (see Figure 3.11), and so result in airway closure and collapse of lung. Pulmonary atelectasis can easily be demonstrated in conscious subjects who voluntarily breathe oxygen close to residual volume,61 and Figure 22.11 shows the effect on arterial Po2 of simulating the reduction in FRC that occurs during anaesthesia. Even if lung collapse does not occur, for example in younger patients, the airway narrowing caused by reduced lung volume creates areas with low ventilation/perfusion  ratios that contribute to impaired gas exchange.62
An important aspect of this problem is whether CC remains constant during anaesthesia or whether it changes with FRC. Earlier studies by Hedenstierna and colleagues suggested that CC remained constant.64 However, two other studies provided convincing evidence that FRC and CC are both reduced in parallel following the induction of anaesthesia.65,66 It is possible that bronchodilatation caused by the anaesthetic counteracts the reduction in airway calibre that would be expected to result from the reduction in FRC (see below). The results of the last two studies suggest that there should be no increased tendency towards airway closure during anaesthesia, but this is clearly at variance with Hedenstierna’s work.62
Compression atelectasis may occur because of changes in chest wall and diaphragm position, which lead to the transmission of high intra-abdominal pressure to the chest and compression of areas of lung. As shown in Figure 22.9 the predominantly caudal distribution of atelectasis also points to a role for changes in the position of the dependent regions of the diaphragm.
Absorption atelectasis67 develops when an airway becomes partially or totally closed and the gas contained within the pulmonary units distal to the airway is absorbed into the blood. Absorption of gas does not in itself cause atelectasis, but in effect accelerates collapse should airway closure occur from either of the preceding mechanisms. The rapid uptake of oxygen into the blood makes an important contribution to the development of absorption atelectasis (see below). The role of absorption in anaesthesia induced atelectasis is disputed.67
Prevention of Atelectasis68
 Preoxygenation. An
  of 1.0 immediately prior to induction of anaesthesia leads to significantly more atelectasis than in patients with an
  of 0.3 or 0.21 during induction.69,70 The crucial
  for worsening atelectasis seems to be above 0.6, as a study comparing an
  of 1.0, 0.8 or 0.6 found cross-sectional areas of atelectasis on CT scans following induction of 5.6%, 1.3% and 0.2% respectively.71
Stay updated, free articles. Join our Telegram channel

Full access? Get Clinical Tree


