Advantages
Disadvantages
Elimination of observer bias/error
Cost
Elimination of the white coat effect
Time commitment on behalf of
More comprehensive assessment of antihypertensive therapy
Patient
Disturbed sleep
Superior prognostic indicator
Cuff discomfort
Calculation of blood pressure loads
May be inaccurate in atrial fibrillation
Evaluation of dipping/non-dipping status
Ability to better assess blood pressure variability
More reproducible over time
Validation of ABP Monitors
The Association for the Advancement of Medical Instrumentation (AAMI) has long recognized the importance of evaluation of the accuracy of ABP monitors. A protocol was first developed in 1987 for the assessment of device accuracy and reliability [18]. The AAMI protocol was followed by a more complex method of independent validation from the British Hypertension Society (BHS) in 1990 [19]. Although the protocols differed, their aim was to establish minimum accuracy standards for these devices in order for them to be considered reliable clinical tools. Since then, both protocols have been revised [20, 21]. In addition to clinical testing, the protocols include recommendations such as labeling information, details for environmental performance, as well as stability and safety requirements.
In an updated version in 1992, the AAMI [20] advised that blood pressure should be measured at the onset and conclusion of the validation study in three positions (supine, seated, and standing) and the difference between the ABPM vs. the reference standard should not be more than 5 mmHg with a standard deviation of 8 mmHg. Additionally, the disparity between the ABPM and the reference sphygmomanometer should be assessed in 20 subjects at the beginning and at the end of a 24-h blood pressure study. This difference should not exceed 5 mmHg in at least 75 % of the readings. For reliability testing, three different instruments should be assessed in a minimum of ten subjects for a total of thirty 24-h ABP studies. It is recommended that a minimum of 75 readings in each of the 24-h studies be obtained, with 15-min intervals during the awake period and 30-min intervals during sleep. The number of satisfactory readings (i.e., no error codes) should exceed 80 % of the total number of readings programmed for the day.
The BHS protocol is a more complex validation protocol that has the grading system outlined in Table 4.2. The BHS protocol calls for multiple phases of validation: (1) before use device validation, (2) in-use (field) assessment, (3) after-use device calibration, (4) static device calibration where the device is rechecked after 1 month of usage, and (5) report of evaluation. Each phase has its passing criteria [21].
Table 4.2
British Hypertension Society Grading Criteria
Absolute difference between standard and test device (mmHg) | |||
|---|---|---|---|
Grade | ≤5 (%) | ≤10 (%) | ≤15 (%) |
A | 60 | 85 | 95 |
B | 50 | 75 | 90 |
C | 40 | 65 | 85 |
D | Worse than C | ||
In 2002, the Working Group on Blood Pressure Monitoring of the European Society of Hypertension approved a new protocol—the European Society of Hypertension International Protocol (ESH_IP) [22]. The main purpose of this protocol was to simplify the previous protocols without compromising their integrity. Briefly, this protocol consists of the following steps:
1.
Observer training and assessment.
2.
Familiarization session.
3.
Validation measurements (done in two phases, with 15 patients required in the first phase and 33 in the second).
4.
Analysis after each phase.
5.
Reporting of results.
This protocol uses “pass” or “fail” for grading the devices as opposed to the A–D classification of the BHS protocol . One of the other differences from the BHS protocol is the exclusion of the pre-validation phases (phases 1–3 in the previous list), thereby considerably reducing time and labor. Also, the specifications regarding observer training reduce errors in the actual measurement of blood pressures and resolve major differences between individual observers. A reduced sample size, a refinement in the range of test blood pressure, and a two-phase system of evaluation will decrease the time and cost required for validation by using fewer total subjects and eliminating extremely inaccurate devices in an initial phase of testing. The international protocol has also been criticized for certain differences from prior protocols [23]. First, the protocol does not specify a range of arm circumference over which the device must be tested. Arm circumference is known to affect the accuracy of blood pressure measurement. Second, the protocol does not specify the maximum number of subjects that can be excluded. Some experts have brought up concerns that this might give the manufacturers excessive control over data reporting. In 2010, the ESH-IP was revised with more stringent validation specifications [24]. These specifications include forms with standardized options for responses in the place of open-ended responses, an age restriction of >25 years, and more stringent pass levels [25]. The 2002 ESH-PI1 and 2010 ESH-PI2 have been the most frequently used validation protocols primarily due to their ease of use compared to the AAMI and BHS guidelines [15, 26].
Hodgkinson et al. conducted a systematic review of validation studies using the AAMI, BHS, ESH-IP1, ISO, and ESH-IP2 protocols and found that the less complicated ESH-IP generated fewer major protocol deviations than the AAMI and BHS [27]. Ultimately, Hodgkinson et al. recommended the ESH-IP2 protocol citing its “simplicity of method and greater accuracy requirement” [27].
Analysis of ABPM Data
Upon completion of the 24-h ABP recording, the data are downloaded and analyzed statistically to calculate blood pressure averages (i.e., 24-h, awake or daytime, and sleep or nighttime) as well as variations on the blood pressure load. The American Society of Hypertension as well as other expert groups have proposed limits of normal blood pressure and blood pressure loads as depicted in Table 4.3 [28].
Table 4.3
Suggested upper limits of normal average ambulatory blood pressure and load
Blood pressure measure | Probably normal | Borderline | Probably abnormal |
|---|---|---|---|
Systolic average | |||
Awake | <135 | 135–140 | >140 |
Asleep | <120 | 120–125 | >125 |
24-h | <130 | 130–135 | >135 |
Diastolic average | |||
Awake | <85 | 85–90 | >90 |
Asleep | <75 | 75–80 | >80 |
24-h | <80 | 80–85 | >85 |
Awake | <15 | 15–30 | >30 |
Asleep | <15 | 15–30 | >30 |
Awake | <15 | 15–30 | >30 |
Asleep | <15 | 15–30 | >30 |
Descriptive Blood Pressure Data from ABPM
Data are generally reported separately for the 24-h, daytime, and nighttime periods. These averages should be accompanied by the standard deviations as a simple indicator of blood pressure variability. A study by Kikuya et al. found an association between increased cardiovascular mortality risk and daytime SBP variability [29]. Some studies have indicated that there is a significant relationship between blood pressure variability and target end-organ damage [30], especially with beat-to-beat intra-arterial data. Frattola et al. conducted a study on 73 essential hypertensives that underwent intra-arterial blood pressure monitoring at the initiation of the study [31]. Subsequently, echocardiography was performed to assess left ventricular mass on subjects at the onset and at the conclusion of the study 7 years later. The standard deviations were obtained, and the average blood pressure variability for the group was calculated as 10.8 mmHg. The authors observed that end-organ damage was significantly higher in patients who had a greater than average blood pressure variability (for the group as a whole) given that the 24-h mean arterial pressure was similar in both groups. Unfortunately, 24-h blood pressure monitoring was not conducted at the end of the study to confirm if the same level of blood pressure variability persisted.
Blood Pressure Loads
The blood pressure load is calculated as the proportion of blood pressures >135/85 mmHg during the awake period and >120/75 mmHg during the sleep hours. White et al. was one of the first groups to introduce the concept of blood pressure loads [32]. They conducted a study in 30 previously untreated hypertensives and observed that the blood pressure load was a sensitive predictor of indices of hypertensive cardiac involvement. The results demonstrated that when the systolic or diastolic blood pressure loads were less than 30 %, the likelihood of LVH was negligible. However, with a systolic blood pressure load exceeding 50 %, the incidence of LVH approached 90 %, and with the diastolic blood pressure load more than 40 %, LVH occurred in 70 % of the subjects [33]. Similar results were obtained when Mule et al. studied 130 patients with mild to moderate hypertension [34]. Subjects with a higher systolic blood pressure load, adjusted for average 24-h SBP, were found to have increased relative myocardial wall thickness and total peripheral vascular resistance as well as increased prevalence of hypertensive retinopathy. These studies suggest that blood pressure load is an independent predictor of hypertensive target organ damage and adverse cardiovascular risk profile. However, this parameter has fallen out of favor in recent years since ‘load’ is not a continuous variable and has no means to differentiate moderate versus severely hypertensive individuals.
White Coat Hypertension (WCH ) and the White Coat Effect (WCE )
White coat hypertension (also called isolated clinic hypertension) is diagnosed when the untreated patient’s 24-h blood pressure is within normal limits, but blood pressure in the clinic is persistently elevated (Fig. 4.1), with clinic BP measurements ≥140/90 mmHg, 24-h ABPM <130/80 mmHg, awake ABPM <135/85 mmHg, and nocturnal ABPM <120/70 mmHg [35]. The prevalence of WCH is reported to be 10 to 20 % of patients with untreated Stage 1 hypertension [36]. Originally thought to be a benign condition, recent WCH studies have found evidence that CV risk in individuals with WCH is between that of normotensives and sustained hypertensives. A meta-analysis by Cuspidi et al. in 2014 showed that people with WCH had increased left ventricular mass index, decreased mitral E/A ratio, and greater left atrial diameter compared to a matched group of normotensive individuals [37]. A key utility of ambulatory BP monitoring in clinical practice is its ability to identify WCH, thereby preventing excessive drug therapy [12, 15]. Nevertheless, patients with WCH do need close observation with ABP performed every 2–3 years to determine whether a more sustained hypertensive pattern has developed [38]. The white coat effect (WCE) is defined as an additional presser response in patients with established and treated hypertension, which causes an overestimation of true blood pressure when measured in the clinic setting (Fig. 4.2). White coat effect parameters are typically defined as: treated patients with hypertension where the office BP is ≥140/90 mmHg, 24-h ABPM <130/80 mmHg, daytime ABPM <135/85 mmHg, and nocturnal ABPM <120/70 mmHg [12].
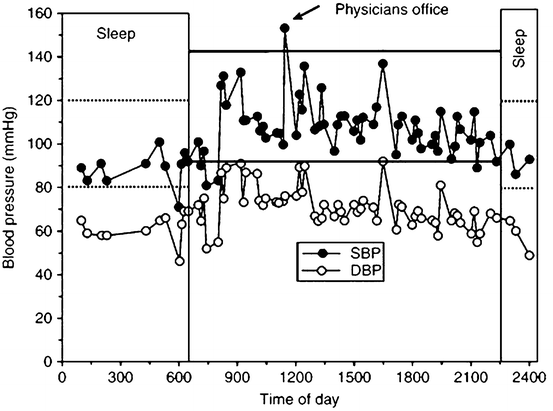
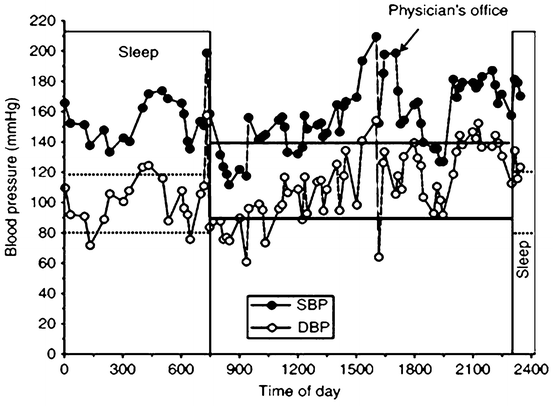

Fig. 4.1
Plot showing 24-h pressure curve depicting white coat hypertension (WCH) and dipping status. The patient’s blood pressure in the physician’s office is 153/76 mmHg. The daytime ambulatory average is normal at 108/71 ± 13/9 mmHg. The subject has WCH with a 45/5 mmHg rise in blood pressure in the physician’s office. The patient also has a normal drop in nocturnal pressures, with a night time average of 90/60 ± 7/6 mmHg

Fig. 4.2
Plot showing 24-h blood pressure curve depicting white coat effect and non-dipper status. The patient is hypertensive with a daytime average of 158/110 ± 21/23 mmHg. The nighttime blood pressure does not drop significantly (157/105 ± 15/16 mmHg). The patient, in addition to his hypertension, has a significant white coat effect in which the blood pressure is 216/98 mmHg in the physician’s office
Masked Hypertension
Masked hypertension (“white coat normotension” or “reverse white coat hypertension”) is an entity that has been closely studied during the past decade.
Masked hypertension is diagnosed when an individual has a normal office (or clinic) blood pressure and an elevated ABP in those patients either not currently being treated for hypertension or on therapy which is not controlling the BP during a 24-h period. The parameters for this condition are typically: untreated patients with office BP <140/90 mmHg, 24-h ABP ≥130/80 mmHg, daytime ABP ≥135/85 mmHg, and/or nighttime ABP ≥120/70 mmHg [35]. Patients with normal office BP in conjunction with stressful occupations, kidney disease, obstructive sleep apnea, LVH, target organ damage, familial history of hypertension, and increased blood pressure during exercise should be considered for ambulatory BP assessment to confirm or deny a diagnosis of masked hypertension [12]. Masked hypertension, which occurs in 10–15 % of normotensive people, is associated with an increased risk of target organ damage as well as cardiovascular mortality [10].
Dipping/Non-dipping/Extreme Dipping
Blood pressure normally has a circadian pattern in which blood pressure drops during sleep and is higher during the awake hours of the day. This pattern is referred to as “dipping” (Fig. 4.1). The dipping status can be determined by evaluating awake and sleep blood pressures and calculating differences between the two averages. The percentage “dip” is then determined by dividing this difference by the awake average. The degree of decline in blood pressure varies from person to person, but a general consensus is that 10–20 % drop in blood pressure during sleep is “normal” [39]. The patient who has less than a 10 % drop in blood pressure at night is referred to as a “nondipper” (Fig. 4.2).
Reporting of Ambulatory BP Data for Medical Records
Using all of the above-referenced values, an informative report can be generated indicating the status of the patient’s blood pressure. The reports should include demographics, all medications taken during the study, the number of accurate readings obtained, the awake/sleep times, and any symptoms that were experienced. The clinical report could also graphically depict blood pressures and heart rates over a 24 h period as shown in Figs. 4.1, 4.2, and 4.3.
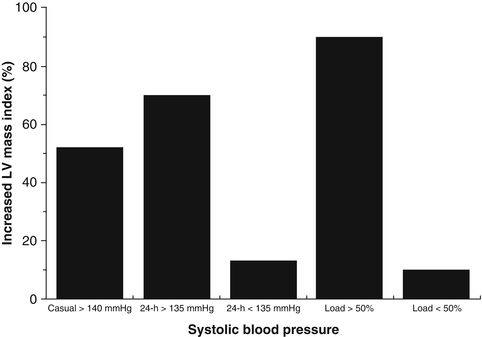

Fig. 4.3
Bars show percentage of increased left ventricular (LV) mass in subjects with elevated systolic blood pressures (both clinical and ambulatory) and systolic blood pressure loads (From ref. [45])
Reproducibility of ABPM
The majority of clinical trials conducted to evaluate ABP reproducibility confirm both superior short-term (<1 year) [40, 41] and long-term (>1 year) [42–44] reproducibility of ABPM as compared to clinical blood pressure measurement. One substudy from the Systolic Hypertension in Europe (SYST-EUR) trial evaluated 112 patients who were randomized to receive placebo [42]. Clinical and ABPM readings done at baseline were repeated after 1 month in 51 subjects and a full year in 112 subjects. The results indicated that differences in 24-h ambulatory systolic blood pressure (2.4 ± 10.7 mmHg [p < 0.05]) were far less than for clinical systolic blood pressure (6.6 ± 15.9 mmHg [p < 0.001]) taken at 1 year (Fig. 4.4). Another large-scale trial that also observed better reproducibility for ABP monitoring than clinical blood pressure was the Hypertension and Ambulatory Recording Study (HARVEST) , in which 508 subjects were evaluated [43]. Ambulatory BP monitoring was conducted at baseline and 3 months later in the untreated state. A very modest difference in the two sequential ABPMs for the group as a whole was observed (0.4/0.7 mmHg).
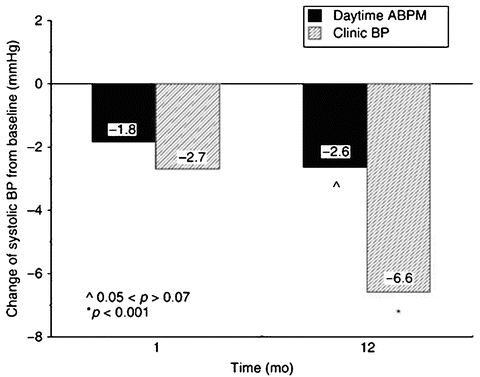

Fig. 4.4
Bars show the superior reproducibility of ambulatory blood pressure (ABP) vs. clinic/office blood pressure from the SYST-EUR trial (n = 112). Blood pressures were measured 1 and 12 months after baseline measurements (From ref. [42])
Studies evaluating the reproducibility of the circadian rhythm have not had such promising results. For example, in a study by Mochizuki et al., it was found that there was limited reproducibility of the circadian rhythm [45]. In that study, 253 untreated essential hypertensives were monitored for 48 h. In these 2 days, 16 % of dippers “converted” into non-dippers and 13 % of non-dippers “converted” into dippers (Fig. 4.5). The authors suggested that 48-h ABP monitors be performed to assess the circadian blood pressure profile of an individual [46]. Although this will not solve the problem entirely, it should decrease the likelihood of error.
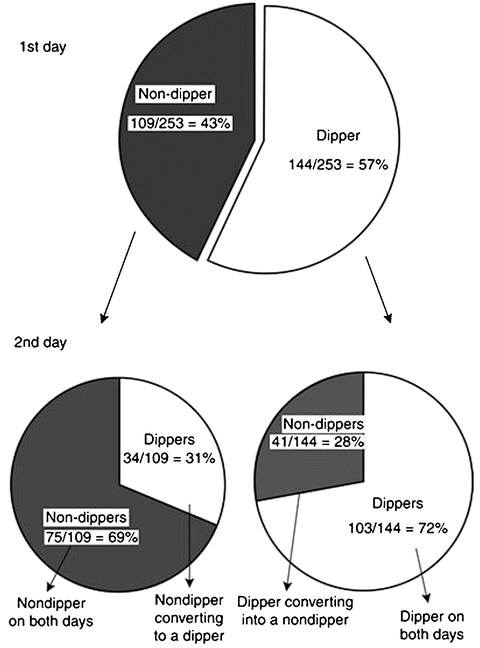

Fig. 4.5
Illustration of the limited reproducibility of the circadian rhythm (i.e., the dipping/non-dipping status) with ambulatory blood pressure monitoring studies conducted over 48 h in 253 subjects (From ref. [45])
Indications for ABPM
ABPM has been recognized as an important clinical tool by a number of expert medical groups and societies. In the US, the Joint National Committee (JNC VII) recommended ABP monitoring for a number of clinical situations (Table 4.4) [39].
Table 4.4
Primary indications for ambulatory blood pressure monitoring
Suspected white coat hypertension |
Apparent drug resistance |
Hypotensive symptoms with antihypertensive medications |
Episodic hypertension < div class='tao-gold-member'>
Only gold members can continue reading. Log In or Register to continue
Stay updated, free articles. Join our Telegram channel
Full access? Get Clinical Tree
 Get Clinical Tree app for offline access

|