Fig. 12.1
2D echocardiogram – Short axis view of a patient with idiopathic pulmonary arterial hypertension showing RV dilatation (red arrow)
Volume calculations of the right ventricle are essential for quantification of RV systolic function. Due to the partly retrosternal location of the right ventricle and the heavily trabeculated RV border, imaging of the right ventricle by conventional echocardiography is challenging. However using complex biplane and multi-slice methods to evaluate RV geometry did not improve the accuracy of the results compared to simple mono-plane area length method [3, 4]. Measurements of RV free wall thickness and RV mass are less practical due to the trabeculations of the RV endocardial surface and the complex RV shape.
To differentiate RV dilation secondary to RV pressure overload from RV dilatation due to increased preload, systolic and diastolic positioning of the inter-ventricular septum (IVS) may be used (Fig. 12.2). Increased RV preload resulted in predominantly end-diastolic leftward IVS displacement while in pure pressure overload this was maximum at end systole [5]. Ryan et al. used a left ventricular eccentricity index, defined as the ratio of the length of two perpendicular minor axis diameters, which were obtained at end systole and end diastole. One of these diameters bisected and was perpendicular to the inter-ventricular septum. In normal subjects in the study the index was 1.0, while in RV volume overload the index was significantly increased at end diastole, and approximately 1.0 at end systole. In the group of patients with RV pressure overload the index was greater than 1.0 in both end systole and end diastole [6].
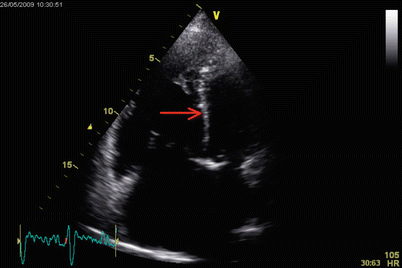

Fig. 12.2
2D echocardiogram – Apical chamber view of patient with idiopathic pulmonary arterial hypertension. There is inter-ventricular septal bowing (arrow) and marked dilatation of right sided chambers
Haemodynamic Assessment of the Right Heart and the Pulmonary Circulation
Bernoulli equation (pressure gradient = 4 V2 mmHg) is used to calculate the pressure gradient driving blood through a cardiac orifice (Fig. 12.3). Tricuspid valve regurgitant jet velocity from the apical 4-chamber view is usually used to calculate tricuspid regurgitant pressure gradient (TRPG) (V = peak tricuspid regurgitant velocity at end diastole). The calculation of systolic pulmonary arterial pressure (sPAP) uses the equation, sPAP = TRPG + Right Atrial Pressure (RAP). This calculation is based on the assumption that there is no right ventricular outflow tract stenosis allowing the right ventricular systolic pressure to be equivalent to sPAP. Although not routinely used in the diagnosis and follow up of pulmonary hypertension echocardiography derived diastolic pulmonary artery pressure (dPAP) and mean pulmonary pressure (mPAP) may be useful when tricuspid regurgitant jets cannot be used. In a study by Lei et al. the peak diastolic and end diastolic pulmonary artery to right ventricular pressure gradients derived by Doppler flow profiles correlated well with measurements at right heart catheterization. A correlation was also observed between pulmonary artery diastolic pressure and Doppler derived end diastolic pressure gradient [7].
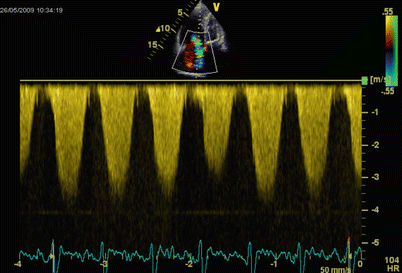

Fig. 12.3
Continuous wave Doppler mapping of the tricuspid regurgitant jet. A tricuspid regurgitant velocity of 4 m/s2 is demonstrated. Using the Bernoulli equation (pressure gradient = 4 V2 mmHg) a TRPG of 64 mmHg could be derived
Right atrial pressure measurement is required to calculate sPAP from tricuspid and pulmonary regurgitant jets. In an early study by Nakao et al., they suggested that inferior vena cava (IVC) diameter of more than 1 cm and area of more than 2.0 cm2 measured by echocardiography at the left lateral position to have sensitivities of 84 % and 73 % and specificities of 95 % and 100 % for the diagnosis of raised right atrial pressure (8 mmHg) respectively [8]. Kircher et al. analysed the respiratory motion of the IVC by two-dimensional echocardiography. They measured the inspiratory and expiratory IVC diameters and suggested the use of percentage collapse (Caval Index) as a predictor of Right atrial pressure (Caval index < 50 % indicate RA pressure ≥ 10 mmHg) [9].
Echocardiography Definition of Pulmonary Hypertension
Pulmonary hypertension is defined as mPAP exceeding 25 mmHg at rest during right heart catheterization. Various attempts have been made to define non-invasive diagnostic criteria of pulmonary hypertension based on echocardiographic findings thus studies have concentrated on defining normal echocardiogram derived pulmonary artery pressures. In a study of 53 healthy people TRPG ranged from 12.6 to 29.3 mmHg. The study authors concluded that TRPG of 30 mmHg should be considered the upper limit of normal [10]. In an analysis of the Massachusetts General Hospital echocardiographic database, 3790 echocardiographically normal subjects had a measured sPAP documented. The estimated upper 95 % limit for sPAP was 37.2 mmHg (RAP = 10 mmHg). A sPAP >40 mmHg was found in 6 % of those >50 years old and 5 % of those with a BMI >30 kg/m2 [11]. The alternative approach has been to estimate mPAP based on pulmonary artery pressures measured by echocardiography. Syyed et al. identified a relationship between sPAP from echocardiography and mPAP from right heart catheterization. They identified a linear relationship (sPAP = 1.5 mPAP + 0.46) which was maintained following changes in posture and activity [12].
Pulsatile Pulmonary Haemodynamics
Kitabatke et al. used a Doppler technique to study the flow velocity patterns of the right ventricular outflow tract. They identified characteristic abnormalities of the pulmonary valve motion in pulmonary hypertension including rapid opening slope in systole and mid-systolic semi-closure of the pulmonary valve. In patients with pulmonary hypertension the flow velocity pattern demonstrated a rapid acceleration reaching a peak level sooner than the normal cohort. Mid systolic notching due to a secondary slower rise during deceleration was also observed in some of the patients. They observed that the time to peak flow (AcT) and the ratio AcT/RVET (Right ventricular ejection time) decreased with rising mPAP [13]. However AcT was shown to be longer in patients with low cardiac index [14] and high pulmonary blood flow in congenital cardiac diseases [15] and shorter in patients with high body surface area [16] and proximal pulmonary emboli [17].
Prognostic Staging and Follow Up
There are specific echocardiographic findings that are important in terms of prognosis in patients with pulmonary hypertension. In a study by Raymond et al. the abnormal echocardiographic findings of presence of pericardial effusion, right atrial enlargement and septal displacement during diastole reflected the severity of right heart failure and predicted adverse events in patients with severe pulmonary hypertension [18]. Tei et al. introduced a Doppler derived index (Tei index or Myocardial performance index) that combined elements of systolic and diastolic function for the assessment of global right ventricular function. The index is calculated using tissue Doppler recordings and is defined as (A-B)/B where A is the time interval between the end and onset of the trans-tricuspid flow and B is the right ventricular ejection time. The A interval includes the isovolumetric contraction time (IVCT), isovolumetric relaxation time (IVRT) and the ejection time, thus the Tei index can also be expressed by the formula (IVCT + IVRT)/RVET. The Tei index was a strong predictor of clinical status and survival and was relatively unaffected by heart rate, right ventricular pressure, right ventricular dilatation or tricuspid regurgitation [19]. Vogel et al. examined the effect of acute changes in loading conditions and contractile functions on the Tei index. In a study of Yorkshire pigs the relationship between dP/dtmax and the Tei index was inconsistent post Dobutamine infusion. The index was significantly affected by acute changes in afterload and preload [20].
In contrast to the left ventricle, which shortens relatively symmetrically in the transverse and longitudinal planes, the right ventricle contraction is predominantly on a longitudinal plane. Thus the displacement of the tricuspid annulus towards the RV apex at systole is correlated with the RV ejection fraction. This measure, known as TAPSE (Tricuspid annular plane systolic excursion) have been found to be highly reproducible and practical [21, 22]. In a prospective observational study by Forfia et al. a TAPSE of less than 1.8 cm was associated with greater RV systolic dysfunction, right heart remodelling and RV/LV disproportion. A high TAPSE (1.8 cm or more) also predicted survival with a 1 and 2-year survival rates of 94 % and 88 % compared to 60 % and 50 % in the low TAPSE group [23]. In a later study in 59 idiopathic pulmonary arterial hypertension (IPAH) patients, the group with TAPSE ≤ 15 mm and a left ventricular eccentricity index ≥1.7 had the highest adverse event rate. Higher TAPSE and a lack of TR predicted a favourable prognosis [24]. An important point to consider is that TAPSE could be pseudo-normalised in significant volume loading as seen in left to right shunting or severe functional TR.
A novel measurement, pulmonary vascular capacitance (PVCAP), was assessed as a predictor of morality in patients with pulmonary arterial hypertension (PAH) in a recent study. PVCAP was defined as stroke volume/pulmonary artery pulse pressure and is measured by two-dimensional and Doppler echocardiography. Patients in the highest PVCAP quartile had a 39 % mortality against 7 % in the lowest quartile [25].
Differential Diagnosis
Echocardiography may also aid in identifying the cause of pulmonary hypertension including left heart disease, congenital cardiac diseases and valvular pathology. It may also help in identifying alternative causes of right ventricular dilatation including right ventricular arrythmogenic dysplasia and right ventricular infarction.
New Developments in Echocardiography
RV measurements by 2-dimensional echocardiography are difficult due to its complex shape. 3-dimensional echocardiography (3D Echo) has been used frequently in the volumetry of the left ventricle and Grapsa et al. compared RV volume and mass data obtained by 3D echo against cardiac MR imaging (Fig. 12.4). They measured RV end diastolic and end systolic volumes, stroke volume and RV mass and compared these findings with CMR. Although CMR showed less inter-observer variability for some measures, RV volume and mass were similar for CMR and 3D echo in PAH patients [26]. In a study comparing 2-D echo to 3D echo, an index of RV contractility corrected for preload (dP/dt/EDV) and right ventricular end-diastolic volume (RVEDV) was measured. The 2D Echo derived contractility index did not correlate with disease severity while 3D echo derived values were potential markers of disease severity [27]. Comparing the two imaging modalities de Bello and colleagues showed that 3D echo derived RV diastolic and systolic volumes as well as ejection fraction to have a higher discriminating power compared to the 2D derived variables [28].
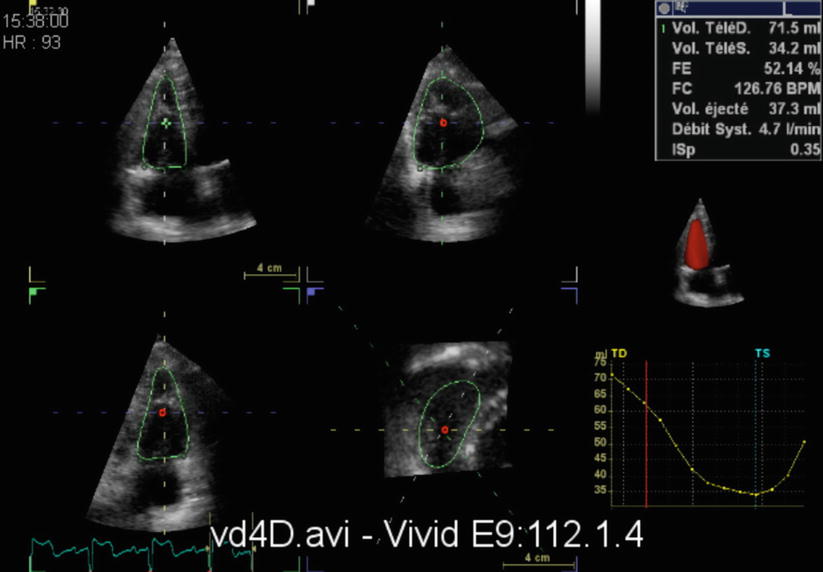

Fig. 12.4
3D Echocardiography – RV volume and ejection fraction by three-dimensional echocardiography
More recently 3-D speckle tracking which has been used extensively in left ventricular functional assessment, has been used to assess patients with pulmonary hypertension. Myocardial strain is defined as the relative lengthening or shortening of a myocardial segment expressed as a percentage of its initial length. The PH population had reduced right ventricular strain and dysynchronous ventricles. Although area strain, longitudinal strain, circumferential strain and radial strain were all reduced in patients with PH, area strain correlated best with RVEF and was the only predictor of mortality [29] (Fig. 12.5).
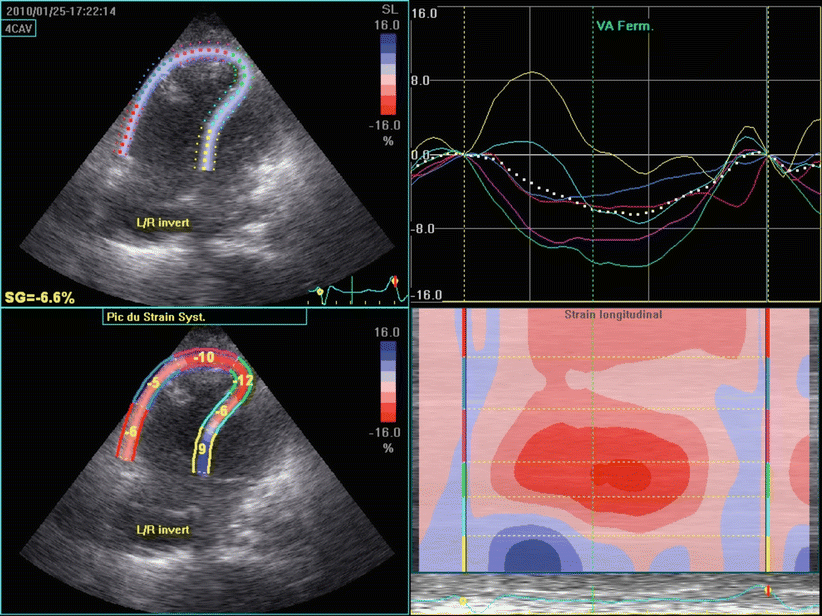

Fig. 12.5
Heterogeneous segmental contraction and dyssynchrony in a patient with pulmonary hypertension
In patients with dilated right ventricles 3D echocardiography has the disadvantage of suboptimal images, and the resulting exclusion of the RV free wall from the imaging has lead to inaccurate volumes. As an alternative to this, Bhave et al. suggested using a “knowledge based reconstruction” method for 3D modelling of the RV endocardium from 2D images. This involved acquiring 2D images localised in 3 dimensional space by a magnetic field generator located under the patient and a magnetic field sensor, then using a reconstruction algorithm to construct a 3D model. This is based on identifying specific landmarks and a reconstructing algorithm using these landmarks to fit sub regions of the right ventricle to hearts in a database of patients with similar pathology. These provided valuable and accurate RV volumes, which compared with CMR, but larger studies are required to determine the practicality of this approach [30].
Chest Radiography
Plain chest radiography usually provide the first clue to the presence of pulmonary hypertension. It is inexpensive and widely available. The Chest x-ray appearance of pulmonary hypertension consist of enlargement of the pulmonary arteries, rapid tapering of the vessels as they extend to the lung periphery and an enlarged heart, particularly the right sided chambers (Fig. 12.6). There is reduction of the size of the intrapulmonary vessels known as peripheral pruning, which is a distinct feature of pulmonary arterial hypertension. Transverse diameter of the proximal interlobar pulmonary artery on posterior-anterior chest radiograph that exceeds 16 mm in men and 15 mm in women is a useful measurement for enlargement of the central pulmonary arteries, likely to be due to pulmonary arterial hypertension in the absence of a left-to-right shunt [31].
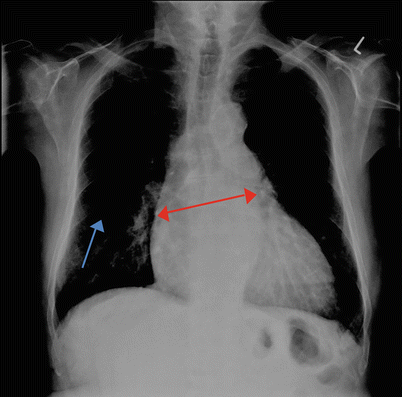

Fig. 12.6
Chest radiograph of a patient with idiopathic pulmonary arterial hypertension. There is cardiomegaly, prominent pulmonary arteries (red arrow) and peripheral oligaemia (blue arrow)
Kanemoto and colleagues reviewed 59 chest radiographs in patients with primary pulmonary hypertension(PPH). They compared five measured values between normal control and PPH group. DPA/(T/2), which is an indicator of the degree of protrusion of the main pulmonary artery, where DPA is the width of the main pulmonary artery from the midline and T the thoracic diameter (divided by half thoracic diameter to eliminate differences) was significantly higher in the PPH group. The average width of the descending branch of the pulmonary artery (dPA) was more than twice that of the control group (12.1–25.1). The PL/T index (The point of union of the external border of the upper lobe artery with the pars interlobaris = point L, the sum of horizontal distances of the right and left L to the midline = Pulmonary Lobar diameter, PL) was increased in the PPH population [32]. Previously Lupi et al. had suggested that the PL/T index as a radiological index suggesting pulmonary arterial hypertension [33].
The normal values for the width of the descending branch of the right pulmonary artery has been reported as 9–13 mm by Schwedel et al. [34] 9–16 mm by Simon et al. [35] and 9–16 mm for men and 9–15 mm for women by Chang et al. [36]
In chronic thromboembolic pulmonary hypertension apart from features of peripheral oligaemia there may be asymmetry of hilar vessels when thrombosis occurs in central pulmonary arteries. Woodruff et al. reviewed 22 chest radiographs of patients with chronic thromboembolic pulmonary hypertension. Cardiac enlargement was defined by a cardiothoracic ratio of more than 0.5 and right ventricular enlargement was defined by a retrosternal cardiac silhouette height greater than one-third the distance between the anterior cardiophrenic sulcus and the angle of Louis. All the patients in both operative and non-operative groups had abnormal chest radiographs. Nineteen patients had cardiomegaly and 13 of these had predominantly right ventricular enlargement. A value of 0.23 for the ratio of the diameter of the main pulmonary artery to the diameter of the left hemithorax (DPA/DHT) was considered normal in a previous study and all but one patient had a higher ratio in this study. Twelve patients had enlarged right descending pulmonary arteries (16 mm for men and 15 mm for women). Specific areas of diminished vascularity were found in about two third of the patients and these were confirmed by pulmonary angiography [37]. Findings of an abnormal chest radiograph in this study and in a further study by Tilkian et al. [38] were in contrast to previous studies by Moser et al. [39] and Benotti et al. [40] who concluded most patients with CTEPH have normal chest radiographs.
Chest X-ray will also provide important clues regarding the cause of pulmonary hypertension including parenchymal lung disease. Although the presence of pulmonary hypertension can be recognised in a plain chest radiograph, the characteristic findings are only likely to be visible in severe disease, which limits the role of chest radiography in diagnosing early or mild pulmonary hypertension. Assessment of peripheral pruning may be subjective and measurements of interlobar arteries are affected by variable magnification and the presence of severe parenchymal lung disease.
Ventilation Perfusion Scintigraphy
Ventilation perfusion scintigraphy (V/Q scan) is a vital investigation in the diagnostic workup of pulmonary hypertension (Fig. 12.7). The sensitivity and specificity of V/Q scanning in distinguishing chronic thromboembolic pulmonary hypertension (CTEPH) from other types of pulmonary hypertension is well documented. In a study in patients with pulmonary hypertension by Worsley et al. a high probability V/Q scan had sensitivity and specificity of 96 % and 94 % respectively in detecting patients with CTEPH [41]. When high and intermediate probability V/Q scans taken in combination the sensitivity and specificity were 100 % and 86 % respectively. In this series none of the patients with normal or low probability V/Q had CTEPH. In a larger retrospective review by Tunariu et al., when only high probability scans were considered of suggestive of CTEPH the sensitivity was 96.2 % with a specificity of 94.6 % [42]. When both high and intermediate probability scans were considered suggestive of CTEPH the specificity fell to 90 %.
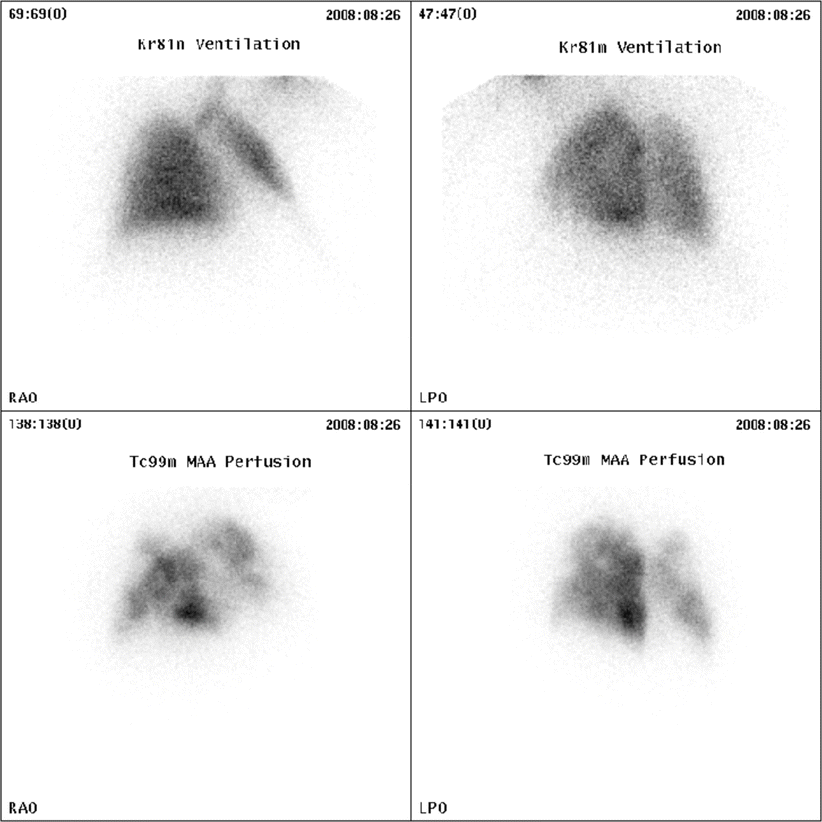

Fig. 12.7
Ventilation perfusion scintigraphy in a patient with chronic thromboembolic pulmonary hypertension showing multiple mismatched perfusion defects
These and a number of other studies demonstrated V/Q scanning to be a safe and highly sensitive test for suspected CTEPH. Grouping intermediate probability results with low probability results provide a highly sensitive and specific investigation in the diagnosis of CTEPH. It is important to note that large mismatched defects at V/Q scanning maybe seen in patients with idiopathic pulmonary arterial hypertension presumably due to thrombosis in situ. These defects may also be seen in other disease processes that affect central arteries and veins such as large vessel vasculitis [43], fibrosing mediastinitis [44], pulmonary artery sarcoma [45] and pulmonary veno-occlusive disease [46].
The introduction of multidetector CT pulmonary angiography (CTPA) has replaced V/Q scanning as first line of the investigation in the diagnosis of acute pulmonary embolism. However the role of CTPA in detecting chronic thromboembolic pulmonary hypertension is variable. Pitton et al. showed multidetector CTPA to have a sensitivity of 70.4 % for segmental and 63.6 % for subsegmental branches when compared to pulmonary digital substraction angiography (DSA) [47]. The retrospective review by Tunariu et al. confirmed that normal V/Q scintigraphy excluded CTEPH whereas normal CTPA did not [42]. In the CTEPH group in this study, CTPA was reported as showing features suggestive of CTEPH in 40 of the 78 patients with a false negative report in 38 of the 78 (sensitivity 51 %). A CTPA report was considered as suggestive of CTEPH, if it stated visualisation of the thrombus, calcified thrombus, recanalization, sudden change of vessel calibre, strictures, poststenotic dilatation, webs or perfusion abnormality. The presence of mosaicism was also noted but its presence alone without other features was not considered diagnostic of CTPEH.
Computed Tomography
There have been dramatic technological advances in computed tomography (CT) in recent years with sub millimetre thick slices, optimal contrast enhancement and improvements in post processing power. CT also has the advantage of imaging the heart and the lung parenchyma as well as the pulmonary arteries and has a greater resolution than other imaging modalities giving a clearer view of morphological changes in the pulmonary vessels. It is also an imaging modality that is often performed as part of the early diagnostic assessment in patients presenting with chest discomfort or dyspnoea. However repeated exposure to radiation precludes CT as a routine test used in assessing disease progression and response to treatment.
The Main Pulmonary Artery Signs
The intra pericardial main pulmonary artery cannot be measured on conventional chest radiography but can be identified and measured on CT. There have been various studies over the years examining the reliability of CT in detecting pulmonary hypertension using variety of methodologies. Although right heart catheterization is gold standard in measuring pulmonary artery pressures, these studies have concentrated on providing a non-invasive surrogate of pulmonary hypertension.
In an early study of 32 patients with cardiopulmonary disease a diameter of the main pulmonary artery above 28.6 mm predicted the presence of pulmonary hypertension (Fig. 12.8). In this study the calculated cross sectional areas of main and interlobar pulmonary arteries normalised to body surface area were found to give the best estimates of PAP [48]. A study by Haimovici et al. found a similar correlation in pre lung or heart-lung transplantation patients [49].
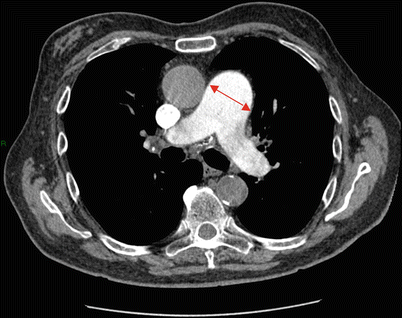

Fig. 12.8
CTPA demonstrating enlargement of the main pulmonary artery (Arrow) in a patient with idiopathic pulmonary arterial hypertension
Ng et al. measured aortic and main pulmonary artery diameters on a single defined axial scan level [50]. The level was at which the right pulmonary artery is in continuity with the main pulmonary artery and sweep across the midline. In this study both the main pulmonary artery diameter (dPA) and the ratio of the main pulmonary artery to the ascending aorta (rPA) were positively related to mean pulmonary artery pressure (mPAP). In patients younger than 50 years of age the mPAP correlated more with rPA than dPA and vice versa in patients older than 50 years of age. They suggested that this may be due to a gradual increase of aortic diameter with age and concluded rPA should be used as a non invasive indicator of the presence of PH. A degree of ‘internal normalisation’ with lack of dependence on body surface area and sex (as both variables influence pulmonary artery and aortic dimensions to a equal degree) as well as technical changes during imaging were suggested as advantages of using rPA over dPA.
In another study in patients with parenchymal lung disease or possible pulmonary vascular disease, CT determined main pulmonary artery diameter of ≥29 mm had a sensitivity of 87 %, a specificity of 89 % and a positive predictive value of 0.97 for predicting PH. The main pulmonary artery was measured at the widest portion within 3 cm of the bifurcation [51].
In a study by Mohammedi et al. the main PA was measured in 4 different ways in order to establish the method with the best correlation to mPAP. The method in which the axial diameter of the main PA, measured along the line that originates from the centre of the adjacent aorta and passes perpendicular to the long axis of the main PA at the level of PA bifurcation, was the most reproducible with the least observer variability. The study showed, a threshold of main pulmonary artery diameter (mPA) > 31.5 mm was found to be 52 % sensitive and 90.2 % specific for pulmonary hypertension. In this study the main PA ratio >1 was 71 % sensitive and 76 % specific for pulmonary hypertension [52]. Truong et al. in the Framingham heart study used the transverse axial diameter of the main pulmonary artery and the ascending aorta at the level of the bifurcation of the right pulmonary artery for their measurements. They established a 90th percentile sex-specific cut off value for mPA for men of 29 mm and women of 27 mm and found an association with dyspnoea using the aforementioned cut off values. Interestingly they did not find an association with dyspnoea when using a 90th percentile cut off value of 0.9 or commonly used value of 1.0 for the pulmonary artery ratio [53].
As noted above, there is a large variation both in terms of the methodology and the reported cut-off diameter of the main pulmonary artery on CT when determining dilatation.
Beyond the Main PA
The studies that measures the calibre of right and left PA and the right interlobar artery did not appear to offer an advantage over main PA measurements on the strength of correlation with right heart catheter derived mPAP. In a study by Tan and colleagues who looked at CT determined measurements of main Pulmonary artery, right and left PA and the ratio between segmental arteries and their corresponding bronchi (ABR), a ratio of more than 1:1 in three of four lobes were higher in the PH population compared to the control group (65 % vs 22 %). The apical segmental arteries and the bronchi of the upper lobes and the posterior basal segmental arteries and the bronchi of the lower lobes were chosen for this study [51]. It is important to note that solitary segmental artery enlargement may be seen in normal patients as well as patients with regional lung abnormalities such as pulmonary fibrosis. In this study the combination of a main PA diameter of or more than 29 mm and an ABR of more than 1:1 in three or four lobes was the most specific finding for the presence of PH (specificity 100 %).
Hypertrophy of the bronchial arteries is a well-recognised radiological feature on conventional angiography and CT pulmonary angiography in patients with chronic thromboembolic pulmonary hypertension (Fig. 12.9). Although the mechanism of bronchial artery hypertrophy is not well understood its role is thought to be to maintain the viability of the lung parenchyma after pulmonary artery occlusion. Hypertrophied bronchial arteries are easily identified on CT and is usually not visualised in normal individuals. Remi-Jardin et al. defined bronchial artery hypertrophy as a curvilinear mediastinal vessel of more than 1.5 mm diameter, which is seen along the course of the proximal bronchial tree. In an earlier study of patients with primary pulmonary hypertension and chronic thromboembolic pulmonary hypertension, they suggested that visualisation of brnchopulmonary collaterals and demonstration of bronchopulmonary collateral flow to be a distinguishing feature of CTEPH from those with primary pulmonary hypertension. However more recent studies have demonstrated bronchial artery hypertrophy to occur in patients with idiopathic pulmonary arterial hypertension as well as Eisenmenger’s syndrome [54].
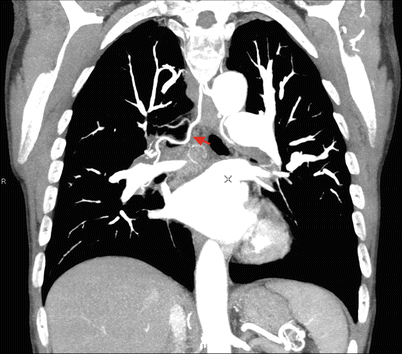

Fig. 12.9
CTPA with coronal reformatted projection showing bronchial artery hypertrophy in a patient with chronic thromboembolic pulmonary hypertension (arrow)
A study by Shimizu et al. showed that in CTEPH patients the cross sectional area of bronchial arteries correlates to the extent of central pulmonary thrombus. When they grouped the CTEPH patients into main, lobar and segmental type based on the most proximal location of thrombi, they did not find any significant difference between the total area of bronchial arteries in segmental type CTPEH and pulmonary arterial hypertension patients. The cross sectional area of bronchial arteries did not have a significant correlation with mPAP or PVR but their presence predicted a better post surgical outcome [55].
Cardiac Signs
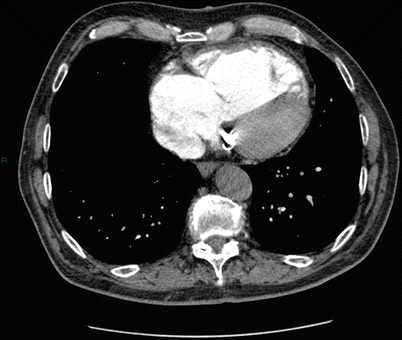
ECG gated CT can be used to obtain information regarding ventricular function and to detect congenital cardiac abnormalities but conventional CT provide information that can be used in the diagnostic workup in patients suspected of having pulmonary hypertension. An axial RV to LV ration of more than 1:1 at the mid ventricular level is indicative of right ventricular enlargement (Fig. 12.10). There may be paradoxical bulging of the inter-ventricular septum towards the left ventricle, although this is better appreciated in cine review of ECG gated studies. When CT features of PH are associated with left sided heart chamber enlargement, pulmonary venous dilation and interlobular septal thickening, this is suggestive of pulmonary venous hypertension with a possible left heart cause. Thickening and calcification of the mitral valve leaflets with associated left atrial enlargement, which is suggestive of mitral valve disease and aortic valve calcification and LV hypertrophy suggestive of aortic valve disease can be identified on conventional CT. Left atrial myxomas, by interfering with mitral valve function and pulmonary vein drainage can occasionally present with pulmonary hypertension and can be identified as a well defined intracavitary mass with low attenuation [56].

