Fig. 11.1
Schematic illustration of basic principles of late gadolinium enhancement (LGE). Time-intensity curve at normal and pathologic myocardium after administration of contrast media (arrow)
11.2.1.2 LGE: Comparison with Other Modalities
The high spatial resolution of LGE enables visualization of even microinfarctions, involving as little as 1 g of tissue.
When comparing SPECT imaging, the main advantage of LGE is its spatial resolution of 1–2 mm (in plane), contrary to about 10 mm with SPECT scans. Therefore, MRI can identify subendocardial necrosis when perfusion by SPECT appears unaltered. LGE also appears to be superior to PET in clear delineation of nonviable myocardium [8].
LGE is in its ability to detect subendocardial LV infarction as well as RV infarction that might be missed using SPECT and PET, because it can clear delineation of nonviable myocardium at any location of the cardiac chamber (Figs. 11.2, 11.3, and 11.4).
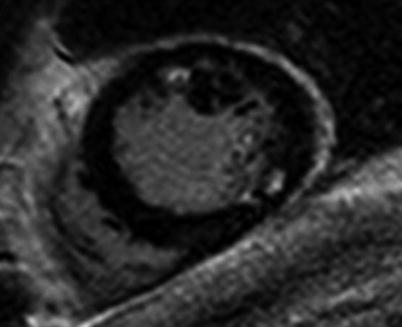
Fig. 11.2
Multifocal subendocardial infarction in anterior and inferolateral wall. High tissue contrast between blood pool and infarcted myocardium allows us to easily see the infarcted area
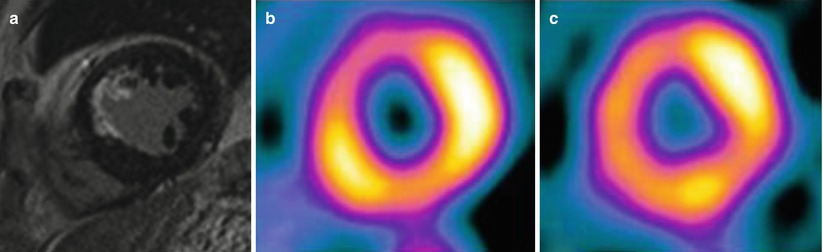
Fig. 11.3
LGE comparison with SPECT for subendocardial infarction. MRI (a) shows subendocardial infarction at anteroseptal wall, but SPECT (b, c) shows reversible perfusion defect
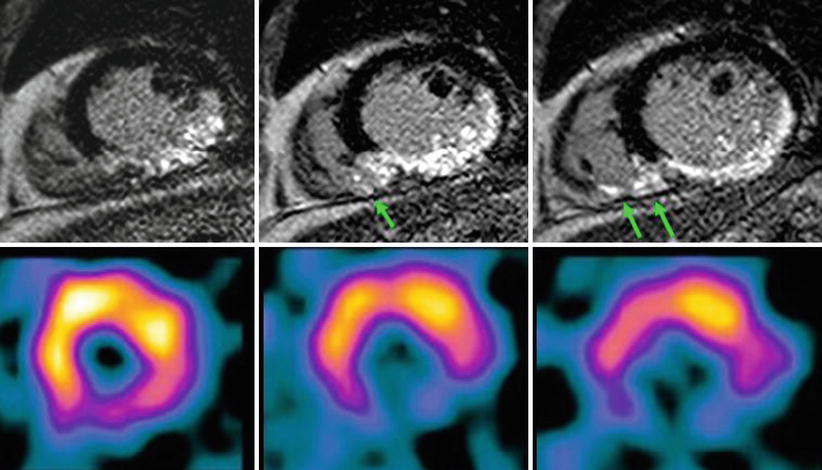
Fig. 11.4
LGE comparison with SPECT for RV infarction. LGE (top image) clearly shows RV infarction. (arrows) as well as inferior LV myocardial infarction. However, SPECT shows only perfusion defect at inferior wall of LV myocardium
11.3 Imaging Findings for AMI
11.3.1 Checklist of Cardiac MRI in AMI
11.3.1.1 Myocardial Edema with Area at Risk on T2-Weighted Images (T2WI)
Myocardial edema in the acute phase of myocardial infarction can be visualized as a bright signal on T2WI, “myocardium at risk.”
T2WI still debate to delineation of the area at risk in ischemic myocardial injury [9].
The major advantages of T2WI:
During the early phase of a coronary occlusion, the subsequent discrepancy between myocardial oxygen supply and demand leads to myocardial ischemia.
If ischemia persists, myocardial injury becomes irreversible, and the necrosis extends from the subendocardium toward the subepicardium, “wave-front phenomenon.”
The final infarct size depends on the extent of the so-called risk area, defined as the myocardial area related to an occluded coronary artery with complete absence of blood flow.
CMR is used to visualize and to quantify the “area at risk,” increased myocardial signal intensity depicted by T2WI are very sensitive to water-bound protons indicating an increased water content with an active myocardial inflammation and tissue edema (Figs. 11.5, 11.6, 11.7, 11.8, and 11.9) [12, 13].
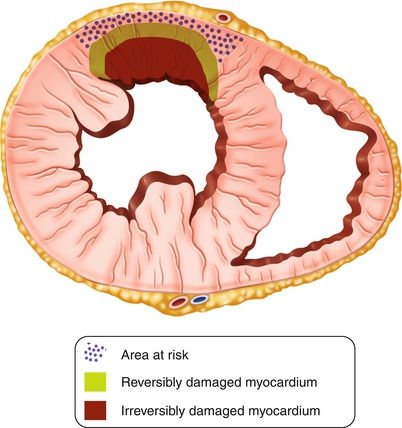
Fig. 11.5
Schematic illustration of the “wave front of myocardial necrosis” in the setting of acute myocardial infarction
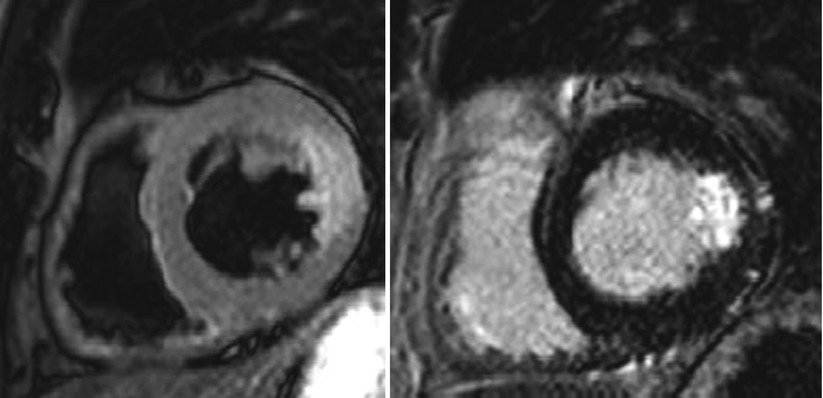
Fig. 11.6
The discrepancy between T2WI and LGE image. T2-weighted image shows transmural edema extending toward all lateral walls. Note the absence of LGE involved by edema representing reversibly damaged myocardium
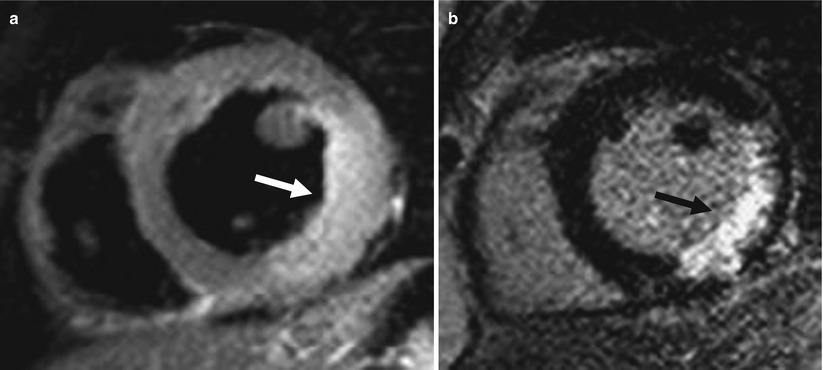
Fig. 11.7
The role of T2WI in differential diagnosis of acute and chronic MI (acute MI: 5 days ago). T2 MRI (a) shows high-signal area at inferior and inferolateral wall with swelling (arrow). LGE (b) also shows hyperenhancement at the same area (arrow)
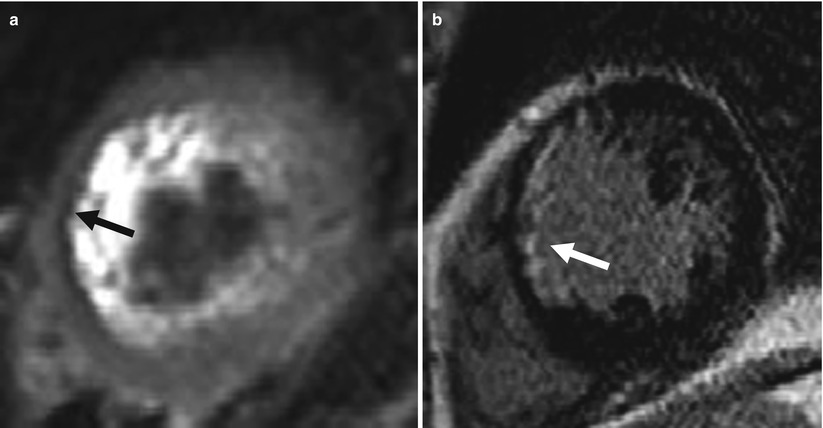
Fig. 11.8
The role of T2WI in differential diagnosis of acute and chronic MI (chronic MI: 9 years ago). T2 MRI (a) shows low-signal area at anterior and anteroseptal wall with thinning (arrow). Slow artifact is seen within LV cavity. LGE (b) also shows hyperenhancement at the vascular territory (LCX) (arrow)
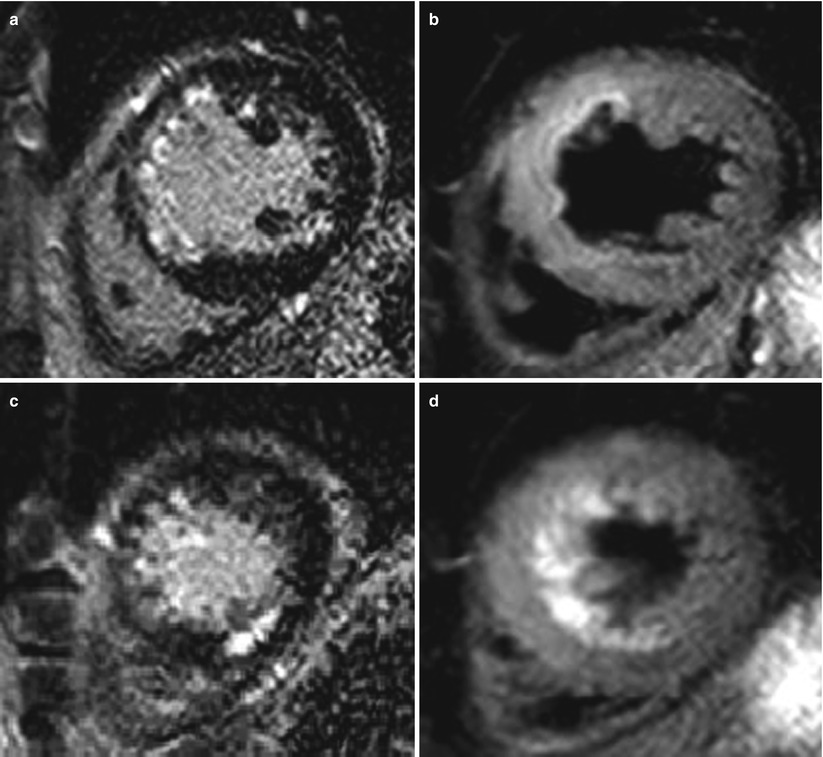
Fig. 11.9
The role of T2WI and LGE in diagnosis of coexisting acute and chronic MI. A 45-year-old male with acute chest pain examined with cardiac MRI. Hyperenhancement at the apical septal and mid-anteroseptal wall with hyperintensity on T2WI, suggestive of acute MI at LAD territory (a, b). However, another abnormal hyperenhancement at the apical inferior wall without definite T2 hyperintensity, suggestive of chronic infarction at RCA territory (c, d)
11.3.1.2 Myocardial Viability
Progression of necrosis
According to the concept of “wave-front phenomenon of myocardial death,” infarct size increases, extending from the endocardium to the epicardium with an increasing duration of coronary occlusion.
The major determinant of final transmural necrosis and microvascular damage is the duration of ischemia [14].
Infarct size measured by LGE is directly associated with clinical outcome.
Improvement of myocardial contractility after treatment can be predicted by the transmural extent of hyperenhancement on LGE [14, 15].
>75 % of transmural extent of infarction has extremely low chance of myocardial salvage (Fig. 11.10).
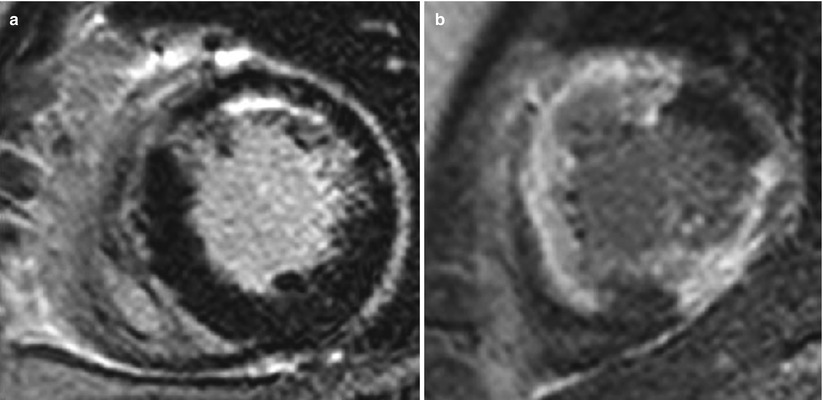
Fig. 11.10
Transmural extent of myocardial infarction. (a) LGE shows subendocardial infarction with 25–50 % transmural extent at the anterior wall. (b) LGE shows infarction with 75–100 % transmural extent at anterior, anteroseptal, and inferior wall
Aborted MI
Patients treated very early in the myocardial infarction triage and intervention (MITI) trial and who had no evidence of MI after the treatment.
Definition: Major (≥50 %) ST-segment resolution of the initial ST-segment elevation and a lack of a subsequential enzyme ≥2 of the upper normal limit.
Aborted MI usually shows homogeneous high signal on T2WI with no or minimal enhancement on LGE along the vascular territory of the culprit lesion (Fig. 11.11) [15].
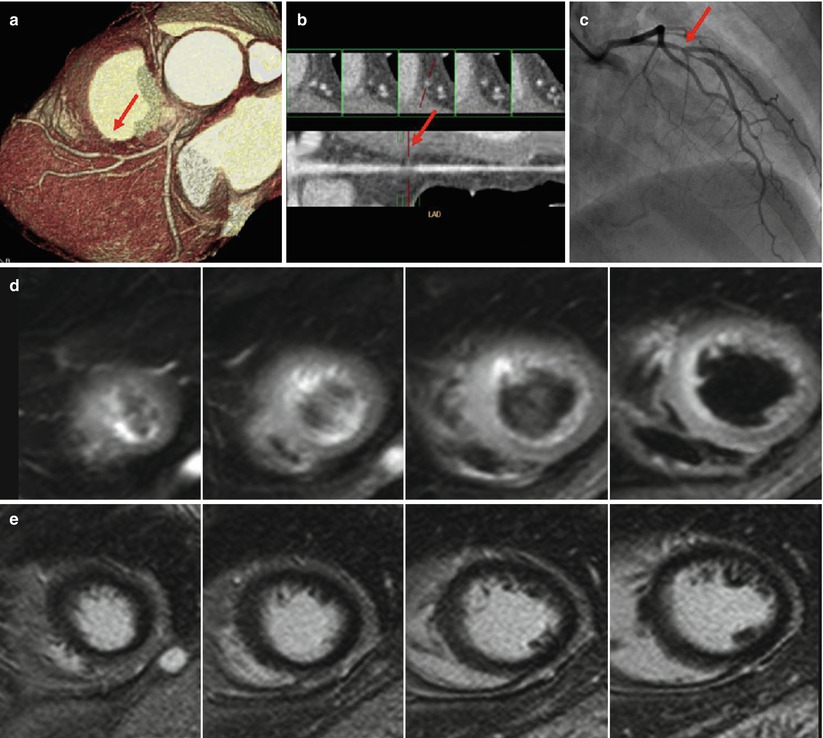
Fig. 11.11
Aborted MI. Severe discrete stenosis (arrow) was noted at mid-LAD on coronary CT angiography (a, b) and conventional angiography (c). Occluded LAD was successfully reopened after percutaneous coronary intervention (c). However, LGE images show no definite enhancement (e). Only T2-weighted images show subtle hyperintensity at the apical septal, mid-anterior, and mid-anteroseptal wall (d)
11.3.1.3 Reperfusion Injury
“No-reflow phenomenon”
Absent distal myocardial reperfusion after a prolonged period of ischemia, despite the successful recanalization of the culprit coronary artery.
Secondary to both luminal obstruction (i.e., neutrophil plugging, platelets, atherothrombotic emboli) and external compression by edema and hemorrhage.
After a prolonged ischemia, the necrosis becomes transmural, and as final consequences a microvascular damage may appear inside the infarction.
Microvascular obstruction (MVO) on LGE
CMR is currently used also to evaluate persistent microvascular dysfunction/damage in the context of white LGE regions (infarcted myocardium) and may coexist dark hypoenhanced areas, traditionally referred to as MVO.< div class='tao-gold-member'>Only gold members can continue reading. Log In or Register to continue

Stay updated, free articles. Join our Telegram channel

Full access? Get Clinical Tree


