4
Abnormalities of P waves, QRS complexes and T waves
When interpreting an ECG, identify the rhythm first. Then ask the following questions – always in the same sequence:
1. Are there any abnormalities of the P wave?
2. What is the direction of the cardiac axis? (Look at the QRS complex in leads I, II and III – and at Ch. 1 if necessary.)
3. Is the QRS complex of normal duration?
4. Are there any abnormalities in the QRS complex – particularly, are there any abnormal Q waves?
5. Is the ST segment raised or depressed?
1. The P wave can only be normal, unusually tall or unusually broad.
2. The QRS complex can only have three abnormalities – it can be too broad or too tall, and it may contain an abnormal Q wave.
3. The ST segment can only be normal, elevated or depressed.
4. The T wave can only be the right way up or the wrong way up.
ABNORMALITIES OF THE P WAVE
Apart from alterations of the shape of the P wave associated with rhythm changes, there are only two important abnormalities:
ABNORMALITIES OF THE QRS COMPLEX
The normal QRS complex has four characteristics:
1. Its duration is no greater than 120 ms (three small squares).
2. In a right ventricular lead (Vj), the S wave is greater than the R wave.
3. In a left ventricular lead (V5 or V6), the height of the R wave is less than 25 mm.
4. Left ventricular leads may show Q waves due to septal depolarization, but these are less than 1 mm across and less than 2 mm deep.
ABNORMALITIES OF THE WIDTH OF THE QRS COMPLEX
QRS complexes are abnormally wide in the presence of bundle branch block (see Ch. 2), or when depolarization is initiated by a focus in the ventricular muscle causing ventricular escape beats, extrasystoles or tachycardia (see Ch. 3). In each case, the increased width indicates that depolarization has spread through the ventricles by an abnormal and therefore slow pathway. The QRS complex is also wide in the Wolff-Parkinson-White syndrome (see p. 79, Ch. 3).
INCREASED HEIGHT OF THE QRS COMPLEX
Right ventricular hypertrophy
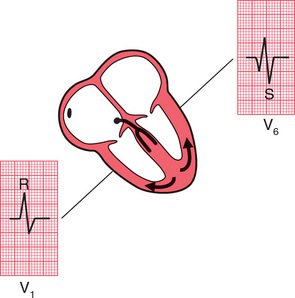
Right ventricular hypertrophy is best seen in the right ventricular leads (especially V1. Since the left ventricle does not have its usual dominant effect on the QRS shape, the complex in lead becomes upright (i.e. the height of the R wave exceeds the depth of the S wave) – this is nearly always abnormal ( Fig. 4.3). There will also be a deep S wave in lead V6.
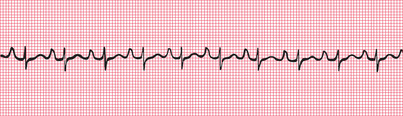
Right ventricular hypertrophy is usually accompanied by right axis deviation (see Ch. 1), by a peaked P wave (right atrial hypertrophy), and in severe cases by inversion of the T waves in leads V1 and V2, and sometimes in lead V3 or even V4 ( Fig. 4.4).
Pulmonary embolism
In pulmonary embolism the ECG may show features of right ventricular hypertrophy ( Fig. 4.5), although in many cases there is nothing abnormal other than sinus tachycardia. When a pulmonary embolus is suspected, look for any of the following:
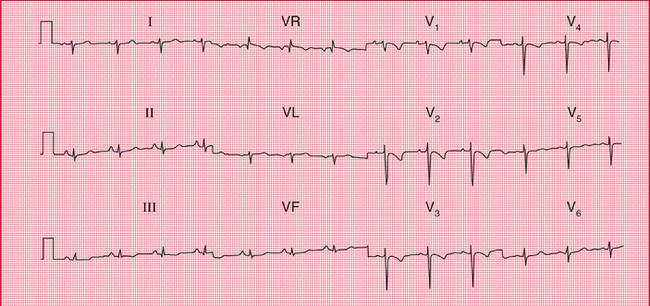
2. Right axis deviation (S waves in lead I).
5. Inverted T waves in lead V1 (normal), spreading across to lead V2 or V3.
6. A shift of transition point to the left, so that the R wave equals the S wave in lead V5 or V6 rather than in lead V3 or V4 (clockwise rotation). A deep S wave will persist in lead V6.
7. Curiously, a ‘Q’ wave in lead III resembling an inferior infarction (see below).
Left ventricular hypertrophy
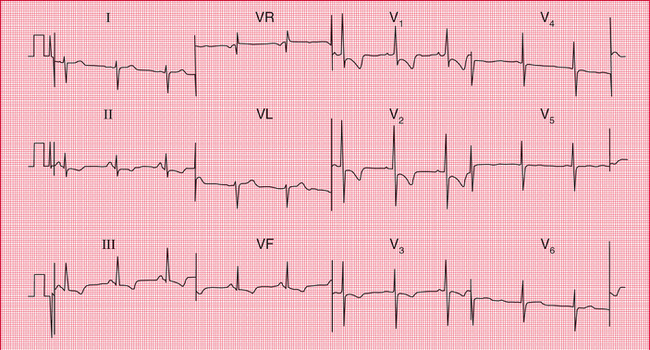
Left ventricular hypertrophy causes a tall R wave (greater than 25 mm) in lead V5 or V6 and a deep S wave in lead V1 or V2 ( Fig. 4.6) – but in practice such ‘voltage’ changes alone are unhelpful in diagnosing left ventricular enlargement. With significant hypertrophy, there are also inverted T waves in leads I, VL, V5 and V6, and sometimes V4, and there may be left axis deviation. It is difficult to diagnose minor degrees of left ventricular hypertrophy from the ECG.
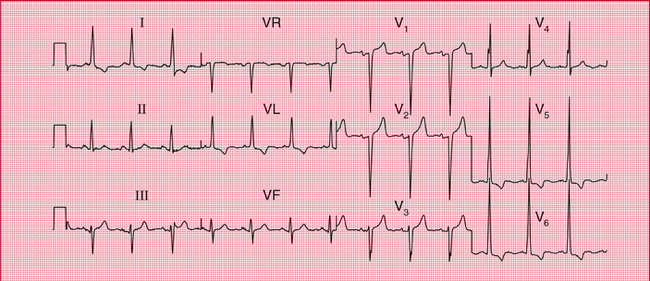
Fig. 4.6 Left ventricular hypertrophy
Note
< div class='tao-gold-member'>
Stay updated, free articles. Join our Telegram channel

Full access? Get Clinical Tree


