Abnormalities in Cardiac Contraction: Systolic Dysfunction
Blase A. Carabello
To sustain life, the heart must pump a cardiac output adequate to supply the tissues’ needs for nutrients. In providing this perfusion, the ventricles must generate enough pressure to overcome the resistance offered by the systemic and pulmonary circulations. This vital function of the heart as a pump is best described by Ohm’s law as it applies to the circulation, where BP = CO × TR (BP, blood pressure; CO, cardiac output; TR, total resistance). Cardiac output, in turn, is maintained by the cyclical contraction and relaxation of the ventricles, which generate pressure and propel blood forward. If the heart fails to perform its function, failure can only occur in three ways: (a) failure of proper cycle generation (i.e., arrhythmia), (b) failure to relax properly (diastolic dysfunction), or (c) failure to contract properly (systolic function). This chapter will address systolic dysfunction. It will define the components of systolic mechanics and ways of measuring abnormalities of these components in the overall assessment of systolic dysfunction.
Over the past 50 years there has been an often-repeated scenario consisting of interest in a new measure of systolic function followed by discoveries of its limitations followed by disuse. After scores of indexes have passed through this cycle, ejection fraction, despite its load dependencies and insensitivity to inotropic change, remains the most commonly used index of systolic function. However, the explosion of transgenic manipulations and the advent of cell and gene therapy for ventricular dysfunction necessitates accurate and sensitive methods for evaluating the success of such therapies. Thus, now more than ever, it is important to consider which forms of evaluation are best suited for assessing systolic function in the modern era.
Determinants of Cardiac Output
Cardiac output is the product of the volume ejected from either ventricle during one beat (stroke volume) and the heart rate. Stroke volume is obtained by measuring cardiac output using a variety of means (e.g., Fick, thermodilution) and dividing by the heart rate or by analyzing cardiac images to obtain end-diastolic and end-systolic volumes. Certainly maintenance of an adequate stroke volume is important to the patient, but obtaining the value for stroke volume gives little information about overall cardiac function or about whether systolic dysfunction exists. For instance, in hemorrhagic shock the underfilled ventricles have a greatly reduced stroke volume even though the ventricles themselves may be perfectly normal. Conversely, in dilated cardiomyopathy a left ventricle ejecting only 20% of an end-diastolic volume of 400 mL maintains a normal stroke volume (80 mL) despite what is obviously severe systolic dysfunction.
To evaluate systolic function, one must take into account the four basic properties that determine stroke volume: preload, afterload, contractility, and myocardial mass. Stroke volume varies directly with preload and contractility and, inversely, with afterload. Additionally, the innate size (mass) of the muscle composing the ventricle is a key determinant of stroke volume; that is, an elephant’s heart produces a greater stroke volume than a rat’s heart, regardless of preload, afterload, or contractility. Furthermore, when the myocardium is overloaded by requirements to generate excess pressure or volume, the major form of long-term compensation is the development of hypertrophy. When the stress is a volume overload, new sarcomeres are laid down in series, producing an increase in myocardial mass
as well as chamber volume (eccentric hypertrophy). When the stress is a pressure overload, new sarcomeres are laid down in parallel, producing increased wall thickness (concentric hypertrophy), which increases myocardial mass but not chamber volume. In evaluating overall cardiac/function, myocardial mass and hypertrophy must be considered together with preload, afterload, and contractility. For instance, in aortic stenosis, the left ventricle may be able to develop a systolic pressure of 270 mm Hg by a doubling of left ventricular mass. However, even though the pressure-generating ability of the entire chamber is increased, individual units of myocardium actually may have depressed contractility (1,2).
as well as chamber volume (eccentric hypertrophy). When the stress is a pressure overload, new sarcomeres are laid down in parallel, producing increased wall thickness (concentric hypertrophy), which increases myocardial mass but not chamber volume. In evaluating overall cardiac/function, myocardial mass and hypertrophy must be considered together with preload, afterload, and contractility. For instance, in aortic stenosis, the left ventricle may be able to develop a systolic pressure of 270 mm Hg by a doubling of left ventricular mass. However, even though the pressure-generating ability of the entire chamber is increased, individual units of myocardium actually may have depressed contractility (1,2).
Preload and Measurement of Preload
The Frank-Starling law of the heart indicates that as end-diastolic volume and diastolic sarcomere stretch increase, force generation increases (3). According to the sliding filaments theory, increased force generation occurs with increased sarcomere stretch up to 2.2 μm. At this sarcomere length, the thin actin filaments are stretched to a configuration allowing maximal cross-bridge interaction with the thick myosin filaments (Fig. 6-1) (4,5). The term preload is intimately linked to the Frank-Starling concept, although no exact definition of preload is universally accepted. Most authorities define preload as the actual sarcomere stretch that exists at the end of diastole. However, others define preload as the force that causes this sarcomere stretch. This difference in definition can lead to real discrepancies in the concept of preload.
For instance, in hypertrophic states where ventricular compliance can be reduced, increased diastolic distending force actually may cause less than normal sarcomere stretch (6). In this case, is preload increased or decreased? Because it is the actual presystolic sarcomere stretch that affects systolic contraction, I favor end-diastolic sarcomere length as the most precise definition of preload. Thus, in the case above, preload is reduced despite increased filling pressure. Unfortunately, defined in this way, preload is difficult to evaluate except in research settings where actual sarcomere length can be obtained. In clinical practice, preload is inferred from end-diastolic pressure, end-diastolic stress, or end-diastolic dimension or volume. Each has its inherent limitations in the assessment of preload. For instance, an end-diastolic pressure of 15 mm Hg might cause near-maximum sarcomere stretch in one patient with a compliant ventricle and much less sarcomere stretch in another patient with a less compliant ventricle. In these two patients the same end-diastolic pressure produces a different preload (sarcomere stretch). End-diastolic stress that takes into account geometry and chamber thickness examines the force producing sarcomere stretch. Although more sophisticated, it shares the same limitations as end-diastolic pressure. A given end-diastolic stress will stretch the sarcomeres to a greater degree in more compliant ventricles than in less compliant ventricles. Fortunately, both end-diastolic pressure and end-diastolic stress may be used as relative indicators of preload if compliance in a given patient has not changed. Thus, although one cannot be certain what the sarcomere stretch is in a given patient, if end-diastolic pressure is increased from 15 to 20 mm Hg, it is likely that preload has increased unless compliance has become reduced, as it might in acute ischemia.
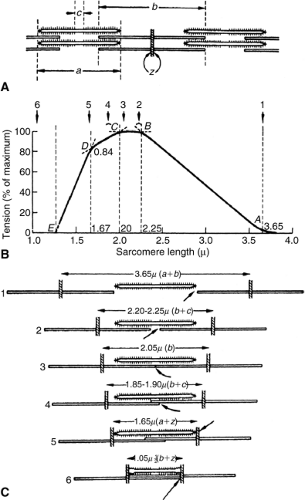 Figure 6-1 Top panel (A) is a schematic of a sarcomere. The thin filaments (actin) are attached at the Z band. The length of two actin filaments as they extend from the Z band is denoted by b. The length of a thick filament (myosin) is denoted by a. Tension is correlated with sarcomere stretch in panels B and C. Position number 1 shows extreme sarcomere stretch where neither actin filament can interact with the myosin filament; thus, tension production is zero. Positions 2 and 3 demonstrate situations of maximal actin myosin overlap; thus tension production is maximal. In positions 4 and 5, the sarcomere has been shortened such that the actin filaments overlap one another, preventing cross-bridge attachment in the overlapping areas, reducing tension development. In position 6 there is complete actin overlap, preventing any cross-bridging with the myosin, and the tension development again is zero. (Reproduced from Braunwald E, Ross J, Jr., Sonnenblick EH, eds. Mechanisms of Contraction of the Normal and Failing Heart. 2nd ed. Boston: Little, Brown; 1972:77 , with permission.) |
End-diastolic dimension or volume is obviously in part dependent on sarcomere stretch. As stretch increases, end-diastolic dimension (or volume) must also increase. However, if eccentric cardiac hypertrophy has intervened, more sarcomeres stretched to a lesser degree produce
the same end-diastolic dimension as fewer sarcomeres stretched to a greater degree in the normal heart. Thus, neither dimension nor volume is a precise measurement of preload. Like end-diastolic pressure and stress, end-diastolic dimension and volume can be used as relative indicators of preload. If end-diastolic dimension in a given patient is increased acutely, it is certain that preload has increased. On the other hand, if in the same patient a volume overload has been interposed and end-diastolic dimension is examined 3 months after volume overloading, an increased diastolic dimension could be due to either increased preload, eccentric hypertrophy (increased number of series sarcomeres), or both.
the same end-diastolic dimension as fewer sarcomeres stretched to a greater degree in the normal heart. Thus, neither dimension nor volume is a precise measurement of preload. Like end-diastolic pressure and stress, end-diastolic dimension and volume can be used as relative indicators of preload. If end-diastolic dimension in a given patient is increased acutely, it is certain that preload has increased. On the other hand, if in the same patient a volume overload has been interposed and end-diastolic dimension is examined 3 months after volume overloading, an increased diastolic dimension could be due to either increased preload, eccentric hypertrophy (increased number of series sarcomeres), or both.
In summary, sarcomere stretch probably is the best definition for preload because it is this property that is one of the key determinants of systolic function. However, no precise, easily obtained method is available for determining this property. End-diastolic pressure, stress, dimension, and volume (if increased acutely in a given patient) usually indicate that preload is increased. Unfortunately, because compliance differs from ventricle to ventricle and because the presence of eccentric cardiac hypertrophy may alter end-diastolic length or volume independent of sarcomere stretch, none of these measures can be used as an absolute measure of preload when comparing one patient or one ventricle with another.
Afterload and Measures of Afterload
Afterload is the force that the myocardium must overcome in order to shorten; it is the force that resists contraction. As this force increases, a ventricle of given strength will be less capable of overcoming the force and will shorten less completely to a greater end-systolic dimension or volume. Thus, evaluation of afterload is important in assessing overall ventricular performance. For instance, under high afterload, a ventricle of normal strength may be unable to shorten normally and thus will appear to have depressed function. This situation has been termed afterload mismatch (7). It can cause the erroneous judgment that ventricular muscle strength is reduced when, in fact, excess afterload is the cause for the poor ventricular performance.
Peripheral resistance, systolic pressure, systolic stress, and systolic impedance all have been used to assess afterload. Total peripheral resistance has several limitations as an indicator of afterload. Mathematically, peripheral resistance = mean arterial pressure / cardiac output. In turn, mean arterial pressure = (2 × diastolic pressure + systolic pressure)/3.
Thus, mean arterial pressure is predominantly determined by a diastolic property. Consequently, total peripheral resistance makes a significant departure from the definition of afterload—the systolic force against which the heart contracts. Although flow occurs only during systole in the proximal aorta, in the periphery, flow is less pulsatile and is present during both systole and diastole. Because most of the peripheral resistance occurs distally at the arteriolar level, some of the flow opposed by this resistance occurs during diastole. Thus, total peripheral resistance is inherently limited as an indicator of afterload by dependence on a diastolic factor. This is probably a key reason why Lang et al. have demonstrated that there may be significant discrepancies between total peripheral resistance and other, more succinct indicators of afterload (8).
Systolic pressure also is used as an indicator of afterload. Because pressure is equal to force divided by area, systolic force is incorporated into the expression of pressure; thus, systolic pressure does reflect afterload. Pressure is an expression of the force that the ventricle must overcome; thus, systolic pressure represents chamber afterload, However, pressure is not normalized for the myocardial mass present. If ventricular hypertrophy is present, there is more muscle to bear the load. In this case, normalization for the amount of myocardium present is needed to examine afterload on individual muscle fibers in assessing myocardial strength. Here, examination of wall stress is a better indicator of myocardial load than pressure. Wall stress in its simplest definition is stated by the Laplace relationship: stress = (p × r)/2h, where p = pressure, r = radius, and h = thickness. Stress normalizes the pressure in the ventricle for its radius and thickness and, thus, examines the force that a unit of myocardium must generate during systole in order to shorten. Although wall stress examines forces occurring in the ventricle itself, stress neglects coupling with vasculature, which is the actual source of the resistance (afterload) against which the ventricle must contract.
In this respect, aortic impedance is a useful indicator of afterload. Descriptively, aortic impedance is the vascular resistance against which the ventricle contracts in systole; it differs from total peripheral resistance, which as previously noted is both a systolic and diastolic phenomenon. Impedance can be measured by examining the Fourier analysis of the instantaneous relationship between systolic aortic pressure and flow. Unfortunately, impedance loses its usefulness as a descriptor of afterload in aortic stenosis or in situations such as mitral regurgitation, where ejection from the left ventricle into more than one chamber occurs. During mitral regurgitation, ejection from the ventricle occurs both into the left atrium as well as into the aorta; thus, aortic impedance only examines partial afterload. In many severe cardiac diseases, ventricular dilatation leads to some mitral regurgitation and diminishes impedance as a useful tool for measuring afterload.
Contractility
Contractility is the ability of the myocardium to develop force independent of loading conditions. In essence, it is the strength of the ventricle. It is this property that is best related to prognosis. Diseases that lead to a reduction in contractility lead to progressive cardiovascular deterioration and eventually to death. Thus, it is not surprising that there have been multiple attempts to measure this prognostic property in both experimental and clinical settings. However, no “contractilometer” exists; that is, there is no simple, precise way to measure ventricular contractility. The ideal index of contractility should be independent of preload, afterload, and myocardial mass but also should be sensitive to small changes in inotropic state and be easy to apply. No currently available index entirely fulfills these criteria. The following section reviews some of the indexes
of contractility that have been used and examines their assets and limitations.
of contractility that have been used and examines their assets and limitations.
Isovolumic Indexes of Ventricular Contractility
As the name implies, isovolumic indexes examine ventricular contraction during the period of isovolumic systole (i.e., after the atrioventricular valves have closed but before the semilunar valves have opened). The cornerstone of the isovolumic indexes of contractile function is the rate of change of ventricular pressure (P) development (dP/dt). In theory, this rate of change reflects the velocity of contractile element shortening before the elastic elements are stretched to the point where they cause overall ventricular shortening (the point at which the semilunar valves open and volume is ejected from the ventricle). Examination of left ventricular dP/dt/P (velocity of shortening) at various pressures before the opening of the aortic valve can be used to extrapolate to the velocity that might have occurred if no pressure were present in the ventricle (9). This property, termed Vmax, is equivalent to the maximum velocity of contractile element shortening if no load were present (Fig. 6-2); it was originally thought to be a good indicator of contractile function.
Vmax is sensitive to changes in contractile state (10). However, some dependence on preload and the need to extrapolate to a theoretical, unconfirmable state has reduced enthusiasm for its use (11). Furthermore, the index was unable to separate patients with clear contractile dysfunction from normal subjects in two important clinical studies, obviously raising questions about the clinical usefulness of Vmax as an accurate index of contractile function (12,13). Maximum dP/dt is also used as a measure of contractility. This index is sensitive to changes in inotropy (14). However, it is unreliable in comparing individuals to themselves over time or in comparing groups of individuals to each other because of a wide range of normal values (12).
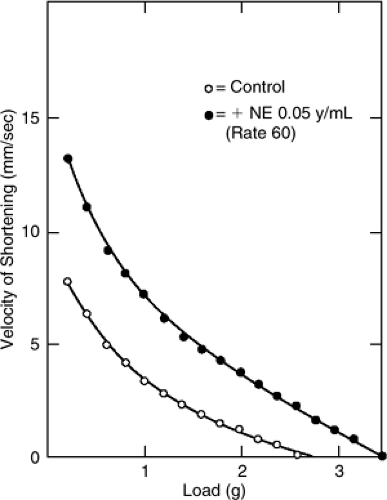 Figure 6-2 Velocity of shortening of a papillary muscle is plotted against load in the control state and in the presence of norepinephrine at several different loads. Extrapolation of these curves to zero load would give the velocity of shortening at zero load (Vmax). Norepinephrine (NE) obviously increased Vmax, indicating increased contractility. (Reproduced from Braunwald E, Ross J, Jr., Sonnenblick EH, eds. Mechanisms of Contraction of the Normal and Failing Heart. 2nd ed. Boston: Little, Brown; 1972:49 , with permission.) |
Ejection Phase Indexes of Contractile Function
The ejection phase indexes of contractile function examine ventricular performance from end-diastole to end-systole. The most popular of such indexes are ejection fraction and the mean velocity of circumferential fiber shortening. Ejection fraction is equal to the stroke volume divided by the end-diastolic volume. Descriptively, it is the percentage of the end-diastolic volume that is ejected during systole. As such, it does not examine force generation (which is part of the definition of contractility) but, rather, examines the global shortening performance of the ventricle.
Ejection fraction has two major advantages as an index of contractile function. First, in a large variety of clinical and experimental circumstances it has been an excellent prognostic indicator of outcome and thus has clinical relevance (15). Second, it is easy to obtain and is dimensionless; it can thus be applied to virtually any patient or experimental subject. Its major drawback (besides the theoretical consideration that it does not examine force generation) is that it is not dependent only on contractility (the property one wishes to measure); it is also dependent on preload, afterload, and cardiac mass (16,17,18). This fact may cause ejection fraction to lead to erroneous conclusions regarding contractility. For example, in mitral regurgitation, where preload is greatly increased and afterload is normal or reduced (19,20), ejection fraction is enhanced by these favorable loading conditions and will overestimate contractility (21). Conversely, in aortic stenosis, where afterload may be increased, ejection fraction may be reduced by afterload mismatch rather than by depressed contractility; thus, ejection fraction may underestimate contractile function in this disease (22).
The mean velocity of circumferential fiber shortening is defined as the shortening fraction divided by ejection time: [(EDD – ESD)/(EDD × ET), where EDD = end-diastolic dimension, ESD = end-systolic dimension, and ET = ejection time]. This index depends less on preload than does ejection fraction (23). However, like ejection fraction, the mean velocity of circumferential fiber shortening (Vcf) is also afterload-dependent.
Afterload-Corrected Ejection Phase Indexes
Because ejection fraction and Vcf are afterload-dependent, plotting them against existing afterload (Fig. 6-3) helps correct for the afterload present. As shown, ejection fraction and Vcf are inversely but linearly related to afterload (wall stress). A given individual can be plotted against the normal ejection fraction-end systolic stress or Vcf-end-systolic-stress relationship to examine contractile function (1,24). A patient whose plot is downward and to the left of this relationship demonstrates decreased ejection performance
for a given amount of afterload. In this circumstance, excess afterload cannot explain reduced ejection performance (because excess afterload is not present or is modest) and the reduced ejection performance is thus likely due to reduced contractile function. This relationship has been used effectively in many studies to infer contractile function. However, to date no universal slope, intercept, and confidence intervals for these relationships have been agreed on. Therefore, each laboratory must develop its own relationship from normal subjects against which patients will be plotted.
for a given amount of afterload. In this circumstance, excess afterload cannot explain reduced ejection performance (because excess afterload is not present or is modest) and the reduced ejection performance is thus likely due to reduced contractile function. This relationship has been used effectively in many studies to infer contractile function. However, to date no universal slope, intercept, and confidence intervals for these relationships have been agreed on. Therefore, each laboratory must develop its own relationship from normal subjects against which patients will be plotted.
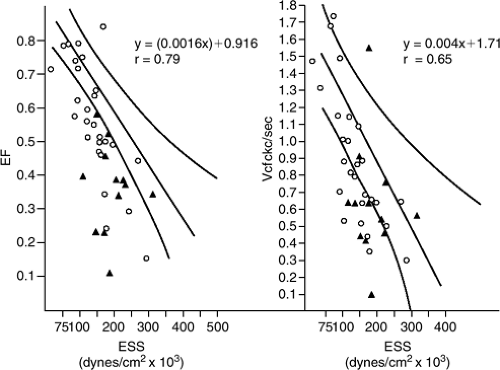 Figure 6-3 Ejection fraction (EF, left panel) and the mean velocity of circumferential fiber shortening (Vcf right panel) are plotted against end-systolic stress (ESS). The slope of the normal relationship and the 95% confidence limits are demonstrated. Patients with valvular disease who had a satisfactory outcome at surgery (O) and those patients with a poor outcome (▲) are plotted against the normal relationships. As can be seen, most patients with a poor outcome fell down and to the left of the normal relationship, indicating that they had reduced contractile function prior to surgery. (Reproduced from Carabello BA, Williams H, Gash AK, et al. Hemodynamic predictors of outcome in patients undergoing valve replacement. Circulation. 1986;74:1309–1316 , with permission.) |
End-Systolic Indexes of Contracility
End-Systolic Volume
End-systolic volume or dimension is dependent on contractile state, afterload, and left ventricular myocardial mass but is not dependent on preload (25). Therefore, by examining end-systolic dimension or end-systolic volume instead of the entire ejection phase, preload is removed as a confounding influence in the determination of contractile function. Not surprisingly, in disease states where preload is exaggerated, such as in aortic and mitral regurgitation, end-systolic volume and end-systolic dimension have been valuable indicators regarding the timing of surgery (26,27,28,29). As end-systolic dimension or volume increases there is a proportionately less favorable prognosis, presumably because contractile function is increasingly depressed. The implication of increased end-systolic volume is that the weaker ventricle is unable to contract as completely as a stronger ventricle and, thus, remains larger at the end of systole.
The End-Systolic Stress: Volume Ratio
As noted above, end-systolic volume is preload-independent but remains dependent on contractile function, afterload, and overall heart size. We, and others, have attempted to correct end-systolic volume by making a ratio of end-systolic stress to end-systolic volume index (21,30). The concept behind the ratio is that a stronger ventricle will contract to a smaller volume against the same afterload than will a weaker ventricle. Thus, the denominator of the ratio will be smaller and the ratio itself will be consequently larger. By incorporating afterload into the index, it seemed that this ratio might better assess contractility than end-systolic volume alone. Unfortunately, the index is still somewhat afterload-dependent (31).
Table 6-1 lists some of the studies in which the ratio of end-systolic stress to volume or end-systolic pressure to volume has been used and the relative success of the index (20,21). We have found it particularly useful in predicting the outcome of patients undergoing surgery for mitral regurgitation, where it has superior predictive accuracy to end-systolic volume alone (21,29).
Time-Varying Elastance and the Slope of End-Systolic Pressure-Volume Relationship
As afterload increases, a ventricle of given contractile function will be less able to overcome the afterload and thus will remain larger at a given time in systole (25). Progressive increases in afterload produce a nearly linear increase in volume. By matching the afterload-volume coordinates from multiple, variably loaded beats, one can develop the slope of the afterload-volume relationship (32,33,34,35,36,37,38,39,40). As demonstrated in Figure 6-4, beginning at the QRS and proceeding through systole, the slope (elastance) of the relationship of pressure (chamber afterload) and volume increases progressively until it reaches a maximum value (Emax) at the end of systole. Thus, elastance varies with time from the beginning of systole. Elastance also varies with contractile state. Maximum elastance increases as contractile function increases, indicating that for any given incremental change in pressure (Δy) the resultant increase in volume (Δx) is less, resulting in a steeper slope (41).
Table 6-1 Published Studies Comparing Various Indexes of Cardiac Function | ||||||||||||||||||||||||||||||||||||||||||||||||||||||||||||||||||||||
|---|---|---|---|---|---|---|---|---|---|---|---|---|---|---|---|---|---|---|---|---|---|---|---|---|---|---|---|---|---|---|---|---|---|---|---|---|---|---|---|---|---|---|---|---|---|---|---|---|---|---|---|---|---|---|---|---|---|---|---|---|---|---|---|---|---|---|---|---|---|---|
| ||||||||||||||||||||||||||||||||||||||||||||||||||||||||||||||||||||||
Stay updated, free articles. Join our Telegram channel

Full access? Get Clinical Tree


