Elevated triglyceride (TG) levels are associated with increased cardiovascular disease risk. In patients with mild-to-moderate hypertriglyceridemia, defined by the European Atherosclerosis Society Consensus Panel as a TG level of 177 to 885 mg/dl (2.0 to 10.0 mmol/L), low-density lipoprotein cholesterol (LDL-C) reduction remains the primary treatment goal. Using data from the indiVidual patient meta-analysis Of statin therapY in At risk Groups: Effects of Rosuvastatin, atorvastatin and simvastatin (VOYAGER) meta-analysis, we analyzed LDL-C and TG reductions in patients with baseline TG ≥177 mg/dl (≥2.0 mmol/L). Least squares mean percentage change from baseline in LDL-C and TG was compared using 15,800 patient exposures to rosuvastatin 5 to 40 mg, atorvastatin 10 to 80 mg, and simvastatin 10 to 80 mg in patients with baseline TG ≥177 mg/dl (≥2.0 mmol/L). Comparisons were made using mixed-effects models with data only from studies directly comparing treatments by randomized design. Mean LDL-C reductions ranged from −26.9% to −55.5%. Rosuvastatin 10 to 40 mg resulted in significantly greater LDL-C reductions than equal or double doses of atorvastatin and simvastatin (p <0.05). Mean TG reductions ranged from −15.1% to −31.3%. Rosuvastatin 10 mg resulted in significantly greater TG reductions than atorvastatin 10 mg (p <0.05). Rosuvastatin 20 and 40 mg resulted in TG reductions similar to those with equal doses of atorvastatin. Rosuvastatin 10 to 40 mg resulted in significantly greater TG reductions than equal or double doses of simvastatin (p <0.05). In conclusion, in patients with hypertriglyceridemia, LDL-C reduction was substantial and dependent on the choice and dose of statin. TG reduction was numerically less than for LDL-C, and additional TG-lowering therapy may be considered to further reduce residual cardiovascular risk.
Elevated plasma triglyceride (TG) levels have been identified as independent predictors of cardiovascular disease (CVD) risk. For patients with severe hypertriglyceridemia (defined as a TG level of >885 mg/dl [>10.0 mmol/L]), a well-established risk factor for pancreatitis, treatment with agents primarily targeting elevated TG is recommended. However, recommendations for mild-to-moderate hypertriglyceridemia (defined as a TG level of 177 to 885 mg/dl [2.0 to 10.0 mmol/L]) are less clear. A number of guidelines describe a TG level of <150 mg/dl (<1.7 mmol/L) as desirable, but low-density lipoprotein cholesterol (LDL-C) reduction remains the primary treatment goal and statins the first-line therapy. The present analysis uses individual patient data from the indiVidual patient meta-analysis Of statin therapY in At risk Groups: Effects of Rosuvastatin, atorvastatin and simvastatin (VOYAGER) database to analyze LDL-C and TG reductions in patients with TG ≥177 mg/dl (≥2.0 mmol/L) undergoing treatment with different statins and doses.
Methods
Data for this analysis were obtained from the VOYAGER database. Detailed patient demographics and methods from the VOYAGER meta-analysis have been reported previously. In brief, VOYAGER comprises results from 32,258 patients in 37 randomized, fixed-dose trials directly comparing (by randomized design) the changes in lipid levels observed during treatment with rosuvastatin, atorvastatin, and simvastatin. The present analysis includes the results of 15,800 patients with baseline TG levels of ≥177 mg/dl (≥2.0 mmol/L) who were treated with rosuvastatin 5, 10, 20, and 40 mg; atorvastatin 10, 20, 40, and 80 mg; and simvastatin 10, 20, 40, and 80 mg. Two studies in which patients had familial hypercholesterolemia were not included.
In this analysis, percent changes from baseline in LDL-C and TG were determined and least squares mean (LSM) ± SEM were calculated. Comparisons between a rosuvastatin dose and either an atorvastatin or simvastatin dose were performed using mixed-effects models that had a fixed effect for treatment and a random effect for trial, using only those studies that directly randomized the treatments being compared. The percentage of patients reaching an on-treatment TG level of <150 mg/dl (<1.7 mmol/L) was calculated after adjustment for study and baseline TG level. Adjustment was done by calculating LSM for logarithm of odds of reaching TG level <150 mg/dl (<1.7 mmol/L). Logarithm of odds was derived from a mixed-effects logistic regression model with baseline TG as a covariate, statin dose as a fixed effect, and study as a random effect. A p value <0.05 was considered to be of statistical significance without adjustment for multiple comparisons.
Results
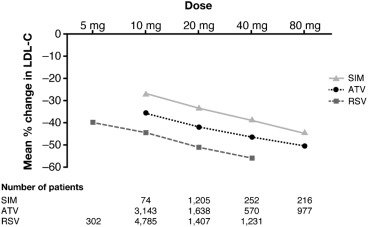
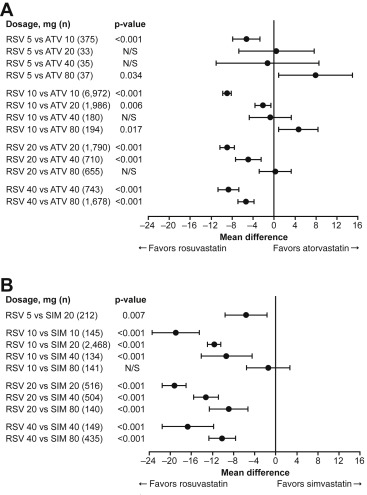
Baseline patient demographic data are presented in Table 1 . A clear relationship between increasing statin dose and reduction in LDL-C was observed ( Figure 1 ). Across all statins and doses, the mean percent reduction (±SEM) in LDL-C ranged from −26.9% (2.0%) to −55.5% (0.8%; Figure 1 ). The differences in LSM percent change in LDL-C between rosuvastatin and equal or higher milligram doses of atorvastatin and simvastatin are shown in Figure 2 . The reductions in LDL-C observed with rosuvastatin 10, 20, and 40 mg were significantly greater than those with equal or double milligram doses of atorvastatin and simvastatin (all p <0.05). Reductions in LDL-C with atorvastatin 80 mg were significantly greater than those with rosuvastatin 5 and 10 mg (p <0.05). In addition, reductions in LDL-C observed with rosuvastatin 5, 10, and 20 mg were greater than those with simvastatin 20, 40, and 80 mg, respectively (p <0.05).
| Characteristic | Patients (n = 15,800) |
|---|---|
| Age, years, mean (SD) | 59.8 (10.5) |
| Men | 9,306 (58.9%) |
| Women | 6,494 (41.1%) |
| Diabetes mellitus | 5,072 (32.1%) |
| TG, mean (SD) | 248.0 (62.0) mg/dl (2.8 [0.7] mmol/L) |
| LDL-C, mean (SD) | 170.1 (34.8) mg/dl (4.4 [0.9] mmol/L) |
| HDL-C, mean (SD) | 42.5 (11.6) mg/dl (1.1 [0.3] mmol/L) |


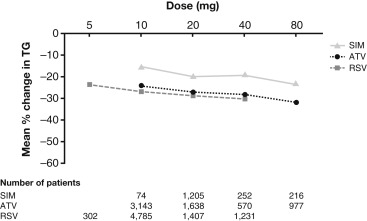
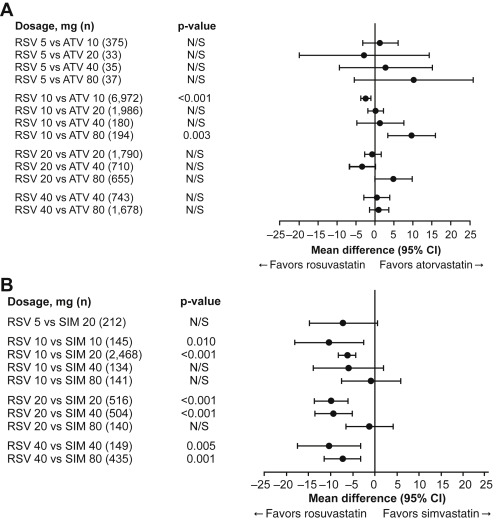
There was also a relationship between increasing statin dose and reductions in levels of TG, although for each statin and dose, the observed mean percent reduction in TG was numerically less than that in LDL-C. Across all statins and all doses, the mean percent reduction (±SEM) in TG ranged from −15.1% (3.2%) to −31.3% (1.4%; Figure 3 ). Differences in LSM percent change in TG between rosuvastatin and equal or higher doses of atorvastatin and simvastatin are shown in Figure 4 . Rosuvastatin 10 mg gave a significantly greater reduction in TG than atorvastatin 10 mg (p <0.001). TG reductions observed with rosuvastatin 20 and 40 mg were similar to those observed with equal doses of atorvastatin. Atorvastatin 80 mg gave significantly greater reductions in TG than rosuvastatin 10 mg (p <0.05). Rosuvastatin 10, 20, and 40 mg resulted in significantly greater reductions in TG than equal or double doses of simvastatin (all p <0.05). The percentages of patients achieving an on-treatment TG level of <150 mg/dl (<1.7 mmol/L), a TG level suggested as desirable in a number of guidelines, are shown in Figure 5 .


Stay updated, free articles. Join our Telegram channel

Full access? Get Clinical Tree


