Fig. 18.1
Representative examples of [Ca2+]i and AP alternans. (a) Representative example of concordant [Ca2+]i and AP alternans in a left ventricular canine myocyte stimulated every 0.8 s. The arrows indicate a sub-threshold early after-depolarization; (b) representative example of phase transitions (a)–(d) between [Ca2+]i and AP alternans obtained during the same data record as (a). In-phase (concordant) [Ca2+]i and AP alternans leads to out-of-phase (discordant) alternans (a) and (c) and back again to in-phase alternans (b) and (d). “A” and “B” denote large and small [Ca2+]i or long and short APD respectively; the peak [Ca2+]i and APD for these beats are also shown [25, 29]
Among the many steps involved in calcium cycling, alternation of calcium entry into the cell via incomplete recovery from inactivation of the L-type calcium channel (I Ca,L) could theoretically lead to [Ca2+]i alternans [9, 19]. However, a number of studies have demonstrated that peak I Ca,L is unchanged during alternans [6, 13, 20, 21], and equally importantly, I Ca,L has been shown to be unaltered in myocytes from diseased hearts [22], making this a less likely mechanism for the lower alternans threshold observed in the failing heart. Furthermore, alternans of [Ca2+]i can be elicited in a high-frequency stimulated myocyte during AP-clamp with similar AP morphology [23], also suggesting that the Ca2+ influx trigger of calcium-induced-calcium-release (CICR) is not the primary event in inducing alternans. The use of small depolarizing pulses [20] to induce alternans may account for alternans encountered at very high stimulation frequencies when most of the L-type Ca2+ channels are unavailable, and thus provide a plausible explanation for the presence of alternans in the normal heart at unusually high stimulation frequencies [4, 5].
Beat-to-beat fluctuations in SR Ca2+ content have also been implicated as a potential mechanism for alternans. SR Ca2+ measurements made during alternans using the indirect approach of measurement of the caffeine-evoked Na+/Ca2+ exchanger (NCX) current have suggested that SR Ca2+ alternates [20, 24, 25]. However, others have shown that while [Ca2+]SR exerts a major influence on SR Ca2+ release, beat-to-beat alternation in [Ca2+]SR is not required for [Ca2+]i alternans to occur [6, 21].
The rate of recovery of the RyR from a refractory (adapted or inactivated) state is another step in the calcium cycling machinery that may give rise to alternans. Given that calcium-induced calcium release is a slower process than either sarcoplasmic reticulum Ca2+-ATPase (SERCA2a) mediated Ca2+ uptake or I Ca,L recovery [26] incomplete RyR recovery on alternate beats at high stimulation frequencies may produce chronotropically induced alternans. With increased steepness of the released Ca2+-SR Ca2+ content relationship, as may occur in diseased hearts [22], small changes in [Ca2+]SR should result in large changes in the beat-to-beat [Ca2+]i, even for a constant I Ca,L trigger [26, 27]. As such, a large [Ca2+]i would be produced when the [Ca2+]SR is relatively high and a disproportionately small [Ca2+]i when the [Ca2+]SR content is relatively low. A large [Ca2+]i would then cause enhanced Ca2+ mediated L-type current inactivation, thus suppressing Ca2+ entry, as well as enhanced Ca2+ extrusion from the myocyte via the NCX [25], all of which results in a lower SR Ca2+ content and hence lower [Ca2+]i on the next beat. The lower [Ca2+]i then results in decreased Ca2+ mediated L-type current inactivation and reduced Ca2+ extrusion through the NCX, leading to increased SR Ca2+ content and a return to the higher [Ca2+]i on the following beat. This sequence sets the stage for concordant cellular alternans between [Ca2+]i and membrane voltage/action potential duration (APD) such that both oscillate in-phase (i.e. large [Ca2+]i corresponds to a long APD and vice versa).
While the use of small depolarizing pulses to induce alternans [20] may differ significantly from the often encountered chronotropic induction of alternans, the biphasic rise in [Ca2+]i [25] has been attributed to an initial steep rise in activation of the RyRs, while the second slower phase has been attributed to wave like propagation. We [25] and others [28] have ascribed this secondary slower phase to secondary RyR openings [25, 29]. We have shown that elevated SR Ca2+ content results in both aberrant SR Ca2+ release and [Ca2+]i alternans, and also gives rise to an inward depolarizing current that results in spontaneous early after-depolarizations (sEADs) and APD prolongation which correlates directly with the magnitude and timing of the aberrant Ca2+ release. We have also shown the presence of discordant cellular alternans between [Ca2+]i and APD at the myocyte level and the importance of [Ca2+]i in defining the in- or out-of-phase relationship between [Ca2+]i and AP (Fig. 18.1b).
In aggregate, these findings support the primacy of alternation in [Ca2+]i in driving APD alternans and also in determining the presence of concordance or discordance between [Ca2+]i and AP morphology within the individual myocyte. Furthermore, experimental evidence suggests that the same Ca2+ cycling perturbations that give rise to cellular alternans can be viewed as inherently coupled processes of an intracellular pathophysiological substrate and trigger events (i.e. transient β-stimulation bursts), which in concert create the necessary conditions for the establishment of cellular alternans.
Many studies have suggested that RyRs are more likely to be triggered by cytosolic Ca2+ when SR luminal Ca2+ is elevated [30, 31] and that increasing SR Ca2+ content increases spontaneous SR Ca2+ release [32] and delayed after-depolarizations (DAD) amplitude towards the threshold to trigger an AP [33, 34]. Furthermore, triggered activity arising from DADs in response to high stimulation rates [35] or to catecholamines has been demonstrated in normal ventricular myocytes [36], experimental heart failure preparations [37] and cardiomyopathic human hearts [38]. These studies provide a plausible justification for the hypothesis that SR Ca2+ “stabilization” at a sub-maximal value is the primary reason for abolishing alternans in studies in which thapsigargin and ryanodine treatment of myocytes markedly suppressed [Ca2+]i and prevented APD alternans [12], and ryanodine treatment alone abolished both tension and AP alternans in papillary muscles [18].
In that context, in the normal heart, CICR is manifest by an operational baseline [Ca2+]SR that is lower than the threshold to trigger spontaneous Ca2+ release. However, high stimulation frequency or β-adrenergic stimulation trigger SR Ca2+ overload that raises the SR Ca2+ baseline level close to or above the threshold at which spontaneous sub-threshold Ca2+ release may occur. In the diseased heart, although the baseline SR Ca2+ level is decreased, the [Ca2+]SR-threshold for RyR opening is also decreased. Although β-adrenergic responsiveness is impaired in the diseased heart [39], even a moderate residual or transient β-adrenergic responsiveness [37] may result in spontaneous sub-threshold Ca2+ release at a lower [Ca2+]SR. The lower than normal [Ca2+]SR-threshold for RyR opening in diseased hearts may explain the presence of electrocardiographic alternans at lower heart rates than in normal hearts (Fig. 18.2).
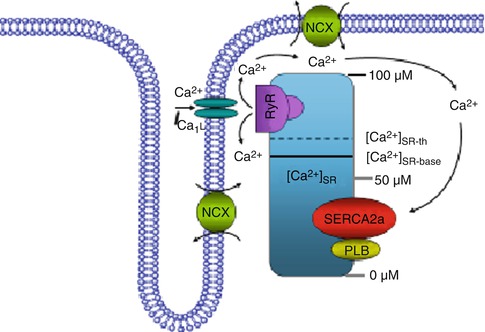
Fig. 18.2
Relationship between cellular calcium content and alternans threshold. Schematic diagram of the effect of the SR Ca2+ content on a proposed model for cellular alternans. Ca2+ cycling though calcium-induced-calcium-release (CICR) includes the L-type Ca2+ channel, the SR Ca2+ ATPase pump (SERCA2a), phospholamban (PLB), the ryanodine receptor (RyR) channel and the Na+/Ca2+ exchanger (NCX). The solid line shows the SR Ca2+ baseline ([Ca2+]SR-base) and the dashed line shows the threshold SR Ca2+ ([Ca2+]SR-th) content at which Ca2+ release occurs. In the normal heart, CICR is manifested by an operational baseline of [Ca2+]SR that is lower than the threshold to trigger spontaneous Ca2+ release. However, high stimulation frequency or β-adrenergic stimulation results in SR Ca2+ overload that raises the SR Ca2+ baseline level above the threshold such that spontaneous sub-threshold Ca2+ release may occur
Further justification for the role of SR Ca2+ content in the genesis of alternans comes from the recent study by Xie and Weiss [28] demonstrating that under control conditions, myocytes become susceptible to Ca2+ overload during rapid pacing and that interactions between spontaneous Ca2+ waves and AP-triggered [Ca2+]i produce sub-cellular spatially discordant alternans (SDA) and even more complex sub-cellular [Ca2+]i patterns. Therefore, the genesis [35, 40] and propagation [41] of Ca2+ waves, which are in general associated with increased SR Ca2+ content through increased luminal Ca2+ sensitization of the RyR to cytosolic Ca2+ and perhaps through increased ability of cytosolic Ca2+ to activate adjacent RyR sites, may essentially reset local [Ca2+]SR [28], and give rise to sub-cellular alternans. According to this mechanism, a partially propagated Ca2+ wave triggers a gradient in SR refractoriness when the next AP occurs. In the region of the myocyte through which the Ca2+ wave has already passed, the affected SR is empty and partially refractory, thus minimizing Ca2+ release. In contrast, the region into which the Ca2+ wave has not entered causes the release of a normal amount of SR Ca2+, resulting in a spatially non-uniform [Ca2+]i. In the next beat, both [Ca2+]SR content and excitability of the refractory region will have recovered, producing a large release, therefore perpetuating the presence of sub-cellular spatially discordant alternans.
The presence of sub-cellular spatially discordant [Ca2+]i leads to increased dispersion of sub-cellular electrophysiologic properties and, in the setting of an appropriate trigger, may lead to an arrhythmia at the cellular level. Although sub-cellular spatially discordant alternans is usually preceded by sub-cellular spatially concordant alternans, under certain circumstances sub-cellular spatially discordant alternans may arise spontaneously [28].
In support of the concept of sub-cellular spatially discordant alternans, it is also possible that as SERCA2a, NCX and RyR function is dynamically regulated on a beat-to-beat basis by many metabolic and ionic factors in the microdomain of the SR [42, 43], SR Ca2+ uptake and release is also dynamically changing, especially in the diseased heart [28, 37, 44], thus creating differential spatial heterogeneity of thresholds for the onset of alternans in different regions of the myocyte [28, 42]. In such cases, small differences of SR Ca2+ content in different parts of the myocyte may exist under basal conditions and these differences may be amplified once the steepness of the relationship between Ca2+ release and SR Ca2+ content begins to rise.
In summary, these data suggest that in the diseased heart, cellular alternans requires a trigger event (such as increased β-stimulation or a Ca2+ wave) and an appropriate sub-cellular substrate to develop. Increasing the probability of RyR opening alone does not produce arrhythmogenic Ca2+ release due to an accompanying decrease in SR Ca2+ content. β-adrenergic stimulation increases SR Ca2+ content and thereby allows the increased RyR open probability to produce Ca2+ release [44]. A trigger event alone may be sufficient to induce alternans in the normal heart; however, it requires supra-physiologic heart rates in order to create a heterogeneous (fragmented) sub-cellular Ca2+ release profile. In the diseased heart, however, perturbations in the intracellular calcium cycling machinery create a sufficiently heterogeneous sub-cellular substrate leading to development of alternans at lower heart rates and predisposing to arrhythmogenesis.
18.2.1 Mechanisms of Alternans in the Intact Heart
As discussed above, the current paradigm suggests that perturbations in cellular calcium cycling processes lead to alternation in cytosolic Ca2+ levels, which then secondarily lead to oscillations in membrane voltage and AP duration. In a manner analogous to sub-cellular spatially concordant and discordant alternans of [Ca2+]i, APD alternans at the tissue or whole heart level can also be spatially concordant or discordant.
Studies in normal hearts using optical mapping techniques have shown that discordant AP alternans (reflecting two adjacent areas of the myocardium that oscillate with opposite phase) is associated with a state of marked cardiac electrical instability, as evidenced by the fact that when ventricular fibrillation occurs following alternans, it only occurs after discordant APD alternans, but never concordant APD alternans [5]. This unstable electrical substrate is consistently induced at a critical heart rate threshold and is largely independent of the pacing site [5], suggesting that it is caused by heterogeneities of cellular repolarization properties and not heterogeneous propagation delay. Interestingly, in this study, alternans most commonly involved the slope of the AP plateau and the onset of final repolarization, timing during CICR that coincides with the timing of aberrant RyR release during alternans observed by our group [25] and others [13].
Recently a two-photon confocal imaging study in the intact rat ventricle [45] has shown that the spatial distribution of [Ca2+]i alternans within the myocyte is time-dependent. Specifically, areas that mark the boundaries between regions of the myocyte that are out of phase during alternans can drift within the myocyte. These phase-mismatched myocyte regions are essentially driven by the myocyte membrane potential, defined by a spatial average potential of all myocytes within the electrotonic space constant, and thus providing a spatial constraint to the region of discordant alternans. Furthermore, the same study [45] has shown that rapid pacing synchronized Ca2+ waves in a sufficient mass of neighboring myocytes to cause DADs at the tissue level. In contrast, sporadic Ca2+ waves in individual myocytes at slow rates had no effect on membrane potential due to source-sink mismatch, wherein the magnitude of the Ca2+ wave (source) is insufficient to overcome diffusion into adjacent myocytes (sink), such that the wave fails to propagate. Thus, if myocytes in a region of tissue synchronously develop Ca2+ waves [45], resulting in sub-cellular alternans, it is possible that the amplitude and the phase of APD alternans in that region may change relative to the surrounding tissue, thus increasing dispersion of APD and generating a potentially arrhythmogenic substrate.
Based on this evidence, it is conceivable that following cardiac “injury”, during the remodeling phase of the heart, the compensatory increase in β-adrenergic stimulation results in progressively increased SR Ca2+ content and a higher probability of inducing alternans. Although in end-stage heart failure the loss of β-adrenergic responsiveness is almost complete [39], in moderate cardiac dysfunction, it is likely that residual β-adrenergic responsiveness results in higher [Ca2+]SR content and spontaneous SR Ca2+ release [37]. As the heart transitions from the compensatory phase to clinical heart failure, cardiac remodeling progresses to the point that the slope of the released SR Ca2+-SR Ca2+ content relationship is steep enough that despite the loss of β-adrenergic responsiveness [39], transient/residual β-adrenergic responsiveness [37] may result in higher [Ca2+]SR content, increased incidence of fractionated, aberrant SR Ca2+ release and Ca2+ waves, and higher probability of alternans occurrence.
In summary, it appears that AP alternans begins in a localized area in the heart and gives rise to micro-volt level alternans [46]. When this region of AP alternans extends to a significant portion of the myocardium (such that it is large enough to overcome the three-dimensional current sink problem) and becomes sufficiently synchronous, it can then be seen on the surface electrocardiogram as repolarization alternans [47]. Localized alternation in APD in turn is associated with delayed recovery on an every other beat basis, resulting in spatial dispersion of recovery, fractionation of depolarization wavefronts and setting the stage for the development of re-entry and arrhythmia onset (Fig. 18.3) [2, 15, 48].
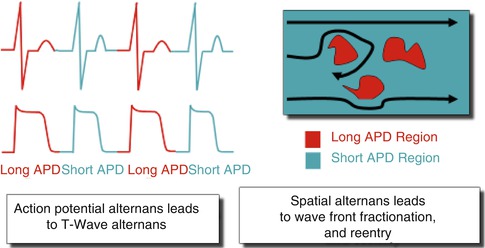
Fig. 18.3
Functional relationship of alternans and re-entry. Localized action potential alternans is manifested as repolarization alternans on the electrocardiogram. Localized regions of tissue exhibiting action potential alternans are associated with delayed recovery on an every other beat basis. These tissue areas of delayed recovery may lead to wavebreak and the development of reentry
18.3 Repolarization Alternans and Clinical Arrhythmia Susceptibility
Microvolt T-wave alternans (MTWA) testing has traditionally been used as a marker of medium- and long-term risk of ventricular tachyarrhythmic events (VTEs) and SCD. T-wave alternans represents an alternating fluctuation in the morphology of cardiac repolarization (ST-segment and T-wave) on the body-surface electrocardiogram (ECG).
The alternans analysis algorithm for the estimation of RA has been previously described in detail [49–53]. Briefly, following R-wave detection and alignment, ST-segment and T-wave annotations are obtained using the wavelet transform and RA is estimated using a rolling 128-beat window that is shifted one beat at a time (Fig. 18.4). Spectral alternans analysis is performed on a beat-by-beat basis for each 128-beat data sequence using a 512-point power spectrum to improve the frequency-domain resolution. To account for the spatial variability of RA, spectral analysis is independently performed for each lead.
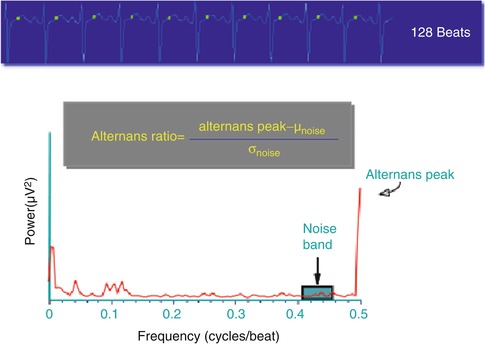
Fig. 18.4
Representative example of the algorithm used to estimate repolarization alternans
Repolarization alternans indices are estimated as follows:

 where, the alternans peak is the peak in the aggregate power spectrum corresponding to 0.5 cycles/beat and the mean (μnoise) and the standard deviation (σnoise) of spectral noise are estimated from a predefined aggregate power spectrum noise window (0.40–0.46 cycles/beat), as shown in Fig. 18.4. The alternans voltage is a direct measure of the presence of alternans while the alternans Kscore is a measure of the statistical significance of the alternans voltage.
18.3.1 Repolarization Alternans and Medium-/Long-Term Arrhythmia Susceptibility
Clinical MTWA testing identifies microvolt-level alternation during low-level exercise or chronotropic stimulation. A robust body of literature has identified a close association between heightened levels of MTWA and risk of VTE/SCD [2, 3, 54, 55]. TWA is believed to represent an electrocardiographic manifestation of spatiotemporal APD heterogeneity and the cellular and sub-cellular mechanisms which give rise to APD alternans (discussed above) likely provide the physiologic substrate for TWA identified on ECG (for a more detailed discussion of clinical MTWA testing, please see Verrier et al. [55] and Rosenbaum et al. [54]).
18.3.1.1 Clinical Value of Microvolt T Wave Alternans
A robust body of clinical literature has demonstrated that MTWA can be used to stratify patients for risk of VTE/SCD with positive and negative predictive values that are comparable to invasive electrophysiologic testing [54]. In general, these studies have demonstrated that patients with a positive MTWA test have a significantly increased risk of VTE/SCD compared to those with a negative MTWA test result. Furthermore, the negative predictive value of MTWA testing has been excellent and consistent with the observation that even among patients with impaired left ventricular ejection fraction (LVEF) (i.e. ≤35 %), those with a negative MTWA have a very low risk of VTE/SCD, on the order of about 1 % per year [56]. In light of this data, there was significant optimism that MTWA testing could serve as a useful tool for identifying patients who were most or least likely to benefit from primary prevention implantable cardioverter-defibrillators (ICDs) [3]. However, more recent studies, including larger percentages of patients implanted with primary prevention ICDs, have raised some doubt about the utility of MTWA testing for this purpose. In particular the MASTER study enrolled 575 patients meeting Multicenter Automatic Defibrillator Implantation Trial II (MADIT-II) criteria for ICDs [57]. All patients underwent MTWA testing followed by ICD implantation. Over 3 years of follow-up, MTWA was not a significant predictor of the primary endpoint of documented VTE, SCD or “appropriate” ICD shocks. In a similar study design, the Sudden Cardiac Death in Heart Failure Trial (SCD-HeFT) investigators performed MTWA testing in a subset of 490 patients enrolled in the overall trial [58]. Again, MTWA testing was not a significant predictor of the same primary endpoint (documented VTE, SCD or appropriate ICD therapy).
Several possible explanations have been proposed to explain the discrepancy between earlier trials in which MTWA testing appeared to be a useful tool for VTE/SCD risk stratification and the more recent studies (MASTER, SCD-HeFT sub-study) in which MTWA has not been a significant predictor. Although differences in the management of β-blockers at the time of MTWA testing [59] may have contributed to differences in study results, it seems likely that the primary cause for the apparent discrepancy involves the use of appropriate ICD therapy as a surrogate for aborted SCD as an endpoint in clinical trials. It is widely acknowledged that appropriate ICD therapy is a relatively poor surrogate for SCD and in the Defibrillators in Non-Ischemic Cardiomyopathy Treatment Evaluation (DEFINITE) trial, the frequency of appropriate ICD therapies among patients randomized to ICDs was more than twofold greater than the rate of SCD in the control arm [60]. This observation has been attributed to the fact that many appropriate ICD therapies treat arrhythmias that would have self-terminated or that ICDs may induce arrhythmias that they subsequently treat [60, 61]. Therefore, in studies that include a high percentage of patients implanted ICDs, the use of appropriate ICD therapy as an endpoint may confound the capacity of MTWA testing to predict risk of VTE/SCD.
In support of this hypothesis, a recent systematic analysis demonstrated that MTWA testing was a significant predictor of VTE/SCD in studies where a relatively small percentage (i.e. ≤15 %) of patients are implanted with ICDs but was a much less robust predictor in studies with higher percentages of ICDs [61]. Furthermore, in a pooled analysis of over 2,800 patients without ICDs, the 2 year risk of SCD among patients with a non-negative MTWA test was over four-fold higher than patients with a negative test result [56]. Both the MASTER trial and the SCD-HeFT sub-study included a large percentage of patients with ICDs and this observation may provide a plausible explanation for the discrepancy between these and earlier studies. Despite the potentially confounding effect of ICDs in recent MTWA studies, the aggregate of clinical data strongly supports the notion that an increased magnitude of RA, as detected by MTWA testing, is closely associated with the substrate that gives rise to VTE/SCD over medium and long-term follow-up. In light of these findings, it is plausible that MTWA testing is best utilized for patients who do not already have ICDs in order to determine whether they are at risk and should be considered for ICD therapy.
There has also been recent interest in the use of MTWA as part of a multi-marker strategy for SCD risk stratification. Current guidelines for primary prevention ICD implantation rely predominantly on assessment of LVEF. However, as highlighted in the recent National Heart, Lung and Blood Institute and Heart Rhythm Society (HLBI/HRS) report on SCD prediction and prevention [62], there is widespread recognition that LVEF reflects only one aspect of the complex electro-anatomic substrate that gives rise to ventricular arrhythmias and in isolation, LVEF is a sub-optimal risk stratification tool. Specifically, among patients who are currently candidates for primary prevention ICD therapy (i.e. LVEF ≤35 %), only a small percentage of patients (~2–5 %/year) will suffer a ventricular arrhythmia resulting in SCD [62], demonstrating that the positive predictive value and specificity of low LVEF for predicting SCD is quite limited. Conversely, the majority of SCD events occur in patients with only mildly impaired or even preserved LV systolic function [63], thus highlighting the limited negative predictive value and low sensitivity of impaired LVEF for determining SCD risk.
In light of this, we have hypothesized that multi-marker SCD risk profiling may provide better risk stratification than individual risk markers used in isolation. In a cohort of over 3,000 patients, we developed a multi-marker profile to predict risk of SCD at 24 months based on three variables: LVEF, MTWA status and presence of coronary artery disease [64]. We sought to characterize the limitations of LVEF for SCD risk prediction by comparing it to the multi-marker model. In Fig. 18.5 we compared the predicted and observed SCD free survival at 24 months for patients with LVEF ≤ or >35 %. Using the multivariate model, patients were divided into four groups based on predicted risk of 24 month SCD: <1, 1–5, 5–10 and >10 %. For patients in each of the four predicted risk groups, the observed rate of SCD was then plotted using Kaplan-Meier estimates. From Fig. 18.5, it is evident that the risk of SCD is not homogeneous for patients stratified by LVEF and important overlap exists between patients above and below the LVEF 35 % threshold. Specifically, among patients with LVEF ≤35 %, approximately 39 % (540 out of 1,389) were predicted to be in the highest quartile of SCD risk based on the multivariate model and the observed event rate in this subgroup approaches 10 % at 24 months, confirming the heightened level of risk. However, a significant minority of patients with LVEF ≤35 % was predicted to be at relatively low risk of SCD at 24 months. Out of 1,389 patients with LVEF ≤35 %, 89 (6 %) had a predicted risk of <1 % and 482 (35 %) had a predicted risk of 1–5 %. The very low observed event rates in these subgroups highlight the significant heterogeneity of risk even among patients with impaired LV systolic function and support the notion of multivariate risk prediction. Figure 18.5 also demonstrates a similarly heterogeneous risk profile among patients with LVEF >35 %. Although the majority of patients with LVEF >35 % (1,167 out of 1,919, 61 %) are predicted to, and observed to, have a very low risk of SCD (<1 % at 24 months), it is evident from the survival curves that a subset of patients with LVEF >35 % can be identified who demonstrate significantly increased SCD risk. Nearly 22 % of patients with LVEF >35 % (420 out of 1,919) are predicted to have a 24 month SCD risk of either 5–10 or >10 % and the observed events rates in these patients clearly seen to exceed the risk among many of the patients with LVEF ≤35 %. With the use of the multi-marker model, this subgroup of patients can be identified as being at heightened risk of SCD but would be missed with the use of LVEF alone.
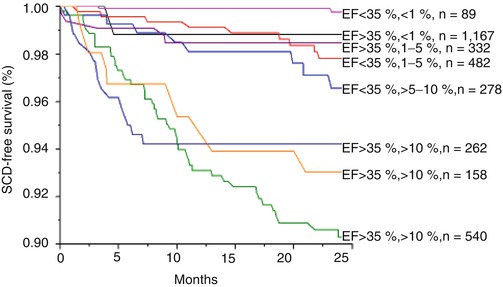
Fig. 18.5
Kaplan-Meier event-free survival curves for the primary endpoint of sudden cardiac death, stratified by predicted SCD risk based on the multivariate model. Using the multivariate model, patients with left ventricle ejection fraction (LVEF) ≤ or >35 % were further stratified into one of four groups based on predicted SCD risk at 24 months: <1, 1–5, 5–10 and >10 %. The survival curves demonstrate that even among patients stratified by LVEF, there is still significant heterogeneity in SCD risk, which can be accurately predicted by the multivariate model. The p value by log-rank test is <0.001, suggesting a significant difference in survival across subgroups
18.3.2 Repolarization Alternans and Acute Arrhythmia Susceptibility
In addition to a role in risk stratifying patients for ICD therapy, recent clinical observations have also suggested that heightened RA may be an important predictor of short-term arrhythmia susceptibility. Analysis of ambulatory body-surface electrograms (Holter monitors) from patients with coronary artery disease has demonstrated a sharp upsurge in RA magnitude (measured by time-domain techniques) within minutes prior to spontaneous VTE [65]. TWA amplitude reached a peak about 10 min prior to the onset of ventricular arrhythmia with a peak magnitude about 25 % higher than during a mean baseline obtained 60–120 min prior the VTE. Sharp upsurges in T-wave alternans immediately preceding spontaneous ventricular arrhythmias have also been documented from body-surface ECGs (leads V1, V5 and aVF) in patients hospitalized for acute heart failure [66]. In this study, TWA increased from a baseline of 18.6 ± 2.1 μV to 27.9 ± 4.6 μV (p < 0.05) during the 15–30 min prior to arrhythmia onset and remained elevated until the occurrence of VTE; results were similar across all three body surface leads.
< div class='tao-gold-member'>
Only gold members can continue reading. Log In or Register to continue
Stay updated, free articles. Join our Telegram channel

Full access? Get Clinical Tree


