Submaximal exercise gas analysis may be a useful method to assess and track pulmonary arterial hypertension (PAH) severity. The aim of the present study was to develop an algorithm, using exercise gas exchange data, to assess and monitor PAH severity. Forty patients with PAH participated in the study, completing a range of clinical tests and a novel submaximal exercise step test, which lasted 6 minutes and incorporated rest (2 minutes), exercise (3 minutes), and recovery (1 minute) ventilatory gas analysis. Using gas exchange data, including breathing efficiency, end-tidal carbon dioxide, oxygen saturation, and oxygen pulse, a pulmonary hypertension gas exchange severity (PH-GXS) score was developed. Patients were retested after about 6 months. There was significant separation between healthy controls and patients with moderate PAH (World Health Organization [WHO] class I/II) and those with more severe PAH (WHO class III/IV) for breathing efficiency, end-tidal carbon dioxide, oxygen saturation, and oxygen pulse. The PH-GXS score was significantly correlated with WHO class (r = 0.51), 6-minute walking distance (r = −0.59), right ventricular systolic pressure (r = 0.49), log N-terminal pro–B-type natriuretic peptide (r = 0.54), and pulmonary vascular resistance (r = 0.71). The PH-GXS score remained unchanged in 22 patients retested (1.50 ± 0.92 vs 1.48 ± 0.94), as did WHO class (2.3 ± 0.8 vs 2.3 ± 0.8) and 6-minute walking distance (455 ± 120 vs 456 ± 103 m). Small individual changes were observed in the PH-GXS score, with 8 patients improving and 8 deteriorating. In conclusion, the PH-GXS score differentiated between patients with PAH and was correlated with traditional clinical measures. The PH-GXS score was unchanged in our cohort after 6 months, consistent with traditional clinical metrics, but individual differences were evident. A PH-GXS score may be a useful way to track patient responses to therapy.
We propose that cardiopulmonary gas exchange obtained with submaximal exercise may provide an important way to track disease severity in pulmonary arterial hypertension (PAH) and that building a scoring system on the basis of the most important variables may provide an index that is more robust than a single gas exchange variable on its own and yet still sensitive to changes in disease severity. Thus, the purpose of this study was to develop a scoring system using noninvasive gas exchange measures. The goal was to take the gas exchange metrics that most clearly separated PAH from healthy controls (i.e., breathing efficiency [V E /V co 2 slope], end-tidal carbon dioxide [P et CO 2 ], oxygen saturation [S a O 2 ], and oxygen pulse [O 2 pulse] at end-exercise) and build a table grading each variable according to severity. Although one would expect this preliminary score to somewhat correlate with other metrics currently used in a clinical setting to determine disease severity in PAH, it was designed to be primarily a gas exchange severity score and thus under certain conditions (i.e., surgical right to left shunt) may not reflect these traditional measures.
Methods
Forty consecutive patients with PAH being treated in the Mayo Clinic Pulmonary Hypertension Unit participated in this study. Thirty-two patients presented with idiopathic PAH, hereditary PAH, PAH associated with the use of diet drugs, or portopulmonary hypertension, while the remaining 8 patients had PAH associated with connective tissue disease. There was very little difference between these 2 groups of patients, as demonstrated in our recent report. Twenty-five age- and gender-matched controls, free of any cardiorespiratory disease, also participated in the study. All participants gave written informed consent after being provided with a description of the study requirements. The study was approved by the Mayo Clinic institutional review board and was performed in accordance with the ethical standards of the Declaration of Helsinki.
Patients completed a range of standard tests, including right-sided cardiac catheterization, echocardiography, and 6-minute walk and pulmonary function testing, in accordance with current clinical practice. In addition, each participant performed a novel submaximal exercise test lasting 6 minutes and consisting of 2 minutes of baseline rest, 3 minutes of progressive step exercise, and 1 minute of recovery, as described in our recent publication. Throughout the test, breathing pattern, gas exchange, and heart rate were monitored using a simplified gas analysis system (Shape Medical Systems, Inc., St. Paul, Minnesota). This new miniaturized and portable device is self-calibrating, containing built-in automated temperature, barometric pressure, and humidity corrections, and has been previously validated against a standardized metabolic gas analysis system. After 2 minutes of baseline measurements, subjects performed a 3-minute step exercise test. For the first minute of exercise, the step rate was set at 1 stride/s (60 strides/min) and was maintained or increased (typically to 90 or 120 strides/min, depending on patient performance), depending on respiratory exchange ratio and perceived exertion, the primary aim being a respiratory exchange ratio of 0.9 and perceived exertion <13, as described previously. On completion of 3 minutes of step exercise, recovery data were collected for a further minute. Clinical and submaximal exercise testing was repeated at 3 and/or 6 months in patients returning for clinical appointments, according to normal clinical follow-up procedures.
Minute ventilation (V E ), breathing frequency, tidal volume, oxygen consumption, carbon dioxide production (V co 2 ), respiratory exchange ratio, and P et CO 2 were obtained breath by breath and averaged over a 30-second period at rest and the last 30 seconds of each minute during exercise. In addition, heart rate and S a O 2 were obtained continuously using pulse oximetry. From these data, derived variables such as V E /V co 2 ratio and O 2 pulse (oxygen consumption/heart rate) were calculated. Ventilatory efficiency slopes (V E /V co 2 slope) (V E in L/min = m[V co 2 in L/min] + b, where m = V E /V co 2 slope) were calculated using all exercise data points via least squares linear regression.
From our previous publication, 4 key exercise gas exchange variables were determined that differentiated patients with PAH and healthy controls and also between differing disease severities. These included V E /V co 2 slope and end-exercise P et CO 2 , S a O 2 , and O 2 pulse. Using these variables, a pulmonary hypertension gas exchange severity (PH-GXS) score was developed.
To create the PH-GXS score, each individual gas exchange variable was given the same weighting in the model. Normal values for each variable were determined as the mean ± SD of the control group (i.e., the control group mean and SD V E /V co 2 slope were 30 and 3, respectively, hence the normal cut-off value was considered 27 to 33 or <33). Equal cut-off points that reflected the distribution of abnormal values were then chosen for each individual parameter in an effort to represent mild PAH, moderate PAH, severe PAH, and very severe PAH (see scoring matrix in Table 1 ). Patient data were then categorized accordingly into 1 of the 5 groups (0 = normal, 1 = mild, 2 = moderate, 3 = severe, and 4 = very severe), and this was done for each of the 4 gas exchange variables. The total score was then tallied and divided by the number of variables in the model as follows: PH-GXS score = (V E /V co 2 score + P et CO 2 score + SaO 2 score + O 2 pulse score)/4. This allowed us to create a gas exchange severity score ranging from 0 to 4, where 0 to 0.49 = normal, 0.5 to 1.49 = mild PAH, 1.5 to 2.49 = moderate PAH, 2.5 to 3.49 = severe PAH, and 3.5 to 4 = very severe PAH.
| Score | V E /VCO 2 | P et CO 2 (mm Hg) | S a O 2 (%) | O 2 pulse |
|---|---|---|---|---|
| 0 (normal) | <33 | >37 | >92 | >9 |
| 1 (mild) | 33–38.9 | 32–36.9 | 88–91.9 | 7.5–8.9 |
| 2 (moderate) | 39–44.9 | 27–31.9 | 84–87.9 | 6.0–7.4 |
| 3 (severe) | 45–50.9 | 22–26.9 | 80–83.9 | 4.5–5.9 |
| 4 (very severe) | >51 | <22 | <80 | <4.5 |
To compare differences in key exercise gas exchange variables between the healthy controls and patients with PAH (World Health Organization [WHO] classes I/II and III/IV), a 1-way analysis of variance was performed. Levene’s test was used to determine equal variance, and subsequently, Bonferroni’s (equal variance assumed) or the Games-Howell (equal variance not assumed) post hoc correction was used to compare between different groups. After the development of the PH-GXS score, correlation analysis was performed to determine how well, or not, this novel classification system compared with traditional clinical measures such as right-sided cardiac catheterization derived pressure data, echocardiographic data, 6-minute walk data, and WHO class. Finally, to compare PAH patient retest data (i.e., test 1 vs test 2) and the ability of the PH-GXS score to track disease severity, a paired Student’s t test was performed. The acceptable type 1 error was set at p <0.05. Results are expressed as mean ± SD and as frequencies and percentages. Statistical analyses were performed using SPSS version 12.0 for Windows (SPSS, Inc., Chicago, Illinois).
Results
Patients with PAH and healthy controls were well matched for age, weight, and height, as demonstrated in Table 2 . Approximately 2/3 of the patients had diagnoses of idiopathic PAH (63%), and 20% of patients had PAH associated with connective tissue disease ( Table 3 ). Patient severity ranged from WHO class I to IV. Patients were taking a variety of medications, with 65% receiving combined therapy consisting of an endothelin antagonist, a phosphodiesterase type 5 inhibitor or a prostacyclin.
| Variable | Controls | Patients With PAH |
|---|---|---|
| (n = 25) | (n = 40) | |
| Women | 80% | 80% |
| Age (years) | 51 ± 15 | 50 ± 13 |
| Height (cm) | 167.8 ± 8.2 | 167.7 ± 7.0 |
| Weight (kg) | 70.1 ± 12.7 | 75.8 ± 16.5 |
| Variable | Value |
|---|---|
| Cause of PAH | |
| Idiopathic | 25 (63%) |
| Hereditary | 4 (10%) |
| Associated with diet drug use | 2 (5%) |
| Portopulmonary hypertension | 1 (2%) |
| Associated with connective tissue disease | 8 (20%) |
| WHO class | |
| I/II | 27 (67.5%) |
| III/IV | 13 (32.5%) |
| 6-minute walking distance (m) (% predicted) | 453 ± 105 (80 ± 19) |
| N-terminal pro–B-type natriuretic peptide (Log NT Pro BNP) | 752 ± 1,229 (2.28 ± 0.68) |
| Echocardiographic data | |
| Right ventricular systolic pressure (mm Hg) | 76 ± 23 |
| Tricuspid annular plane systolic excursion by M-mode (mm) | 21 ± 5 |
| Lateral annular systolic velocity (ms) | 0.13 ± 0.03 |
| Pulmonary function data (n = 32) | |
| Forced ventilatory capacity (L) (% predicted) | 3.2 ± 0.8 (86 ± 16) |
| Forced expiratory volume in 1 second (L) (% predicted) | 2.5 ± 0.6 (80 ± 14) |
| Diffusion capacity for carbon monoxide (ml/min/mm Hg) (% predicted) | 17.6 ± 4.8 (71 ± 14) |
| Medications | |
| Endothelin antagonists | 58% |
| Phosphodiesterase type 5 inhibitors | 73% |
| Prostacyclin | 48% |
| Digitalis | 33% |
| Diuretics | 60% |
Patient clinical data are also listed in Table 3 . Group mean echocardiographic and 6-minute walk data demonstrated a mean right ventricular systolic pressure and 6-minute walk distance of 76 ± 23 mm Hg and 453 ± 105 m, respectively. A subgroup (n = 15) of patients with PAH who underwent right-sided cardiac catheterization had a mean pulmonary artery pressure, mean right atrial pressure, cardiac index, and pulmonary vascular resistance of 55 ± 10 mm Hg, 10.5 ± 5.3 mm Hg, 2.35 ± 0.59 L/min/m 2 , and 10.9 ± 4.4 Wood units, respectively.
Significant differences were observed in V E /V co 2 slope, P et CO 2 , and O 2 pulse between healthy controls, patients with moderate PAH (WHO class I/II), and those with more severe PAH (WHO class III/IV) ( Table 4 ), as described in our previous report. The PH-GXS score was developed using these key gas exchange variables, the results of which are listed in Table 5 . Most patients with PAH had mild (43%) to moderate (20%) classifications, while 26% of patients had severe or very severe PAH according to gas exchange. The remaining patients (13%) had relatively normal gas exchange responses to exercise, which is likely due to the therapeutic treatments being taken.
| Variable | Controls (n = 25) | Patients With PAH (WHO Class I/II) (n = 27) | Patients With PAH (WHO Class III/IV) (n = 13) |
|---|---|---|---|
| V E /V co 2 | 29 ± 4 | 35 ± 8 ⁎ | 48 ± 8 ⁎ , † |
| P et CO 2 at end-exercise (mm Hg) | 40 ± 3 | 34 ± 6 ⁎ | 26 ± 5 ⁎ , † |
| S a O 2 at end-exercise (%) | 94 ± 2 | 90 ± 4 ⁎ | 88 ± 6 ⁎ |
| O 2 pulse at end-exercise | 11.8 ± 3.1 | 9.5 ± 3.0 ⁎ | 6.9 ± 2.4 ⁎ , † |
⁎ Significant differences between control and PAH groups (p <0.05).
| Classification | Patients |
|---|---|
| Normal (0–0.49) | 5 (13%) |
| Mild (0.5–1.49) | 17 (43%) |
| Moderate (1.5–2.49) | 8 (20%) |
| Severe (2.5–3.49) | 9 (23%) |
| Very severe (3.5–4) | 1 (3%) |
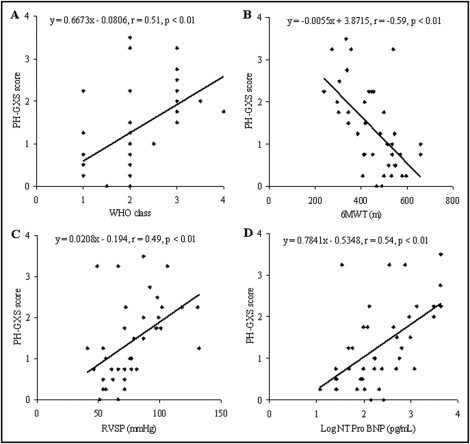
To compare the PH-GXS score with current clinical data, simple linear regression analysis was performed. Our PH-GXS score correlated well with WHO class, 6-minute walking distance, right ventricular systolic pressure, and log N-terminal pro–B-type natriuretic peptide ( Figure 1 ) . In patients who underwent right-sided cardiac catheterization (n = 15), there was a significant correlation between PH-GXS score and pulmonary vascular resistance but no correlation between mean pulmonary artery pressure or mean right atrial pressure and PH-GXS score ( Figure 2 ) , while there was a trend that suggested a relation between cardiac index and PH-GXS score ( Figure 2 ).