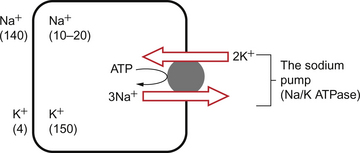
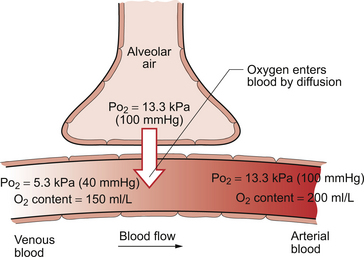
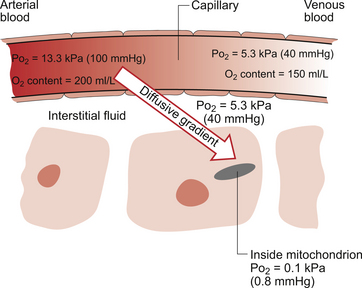
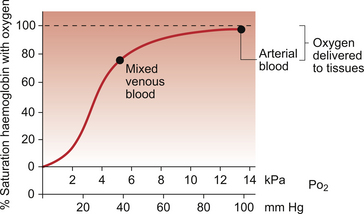
A DESIGN SPECIFICATION FOR THE CARDIOVASCULAR SYSTEM

1


A DESIGN SPECIFICATION FOR THE CARDIOVASCULAR SYSTEM


The gross structure and function of the cardiovascular system is dictated firstly by the need to deliver oxygen continuously to the 100 000 000 000 000 (1014) cells which make up the ‘textbook person’. Oxygen is used by cells to generate ATP, the metabolic energy source for all the functions of the body. Oxygen is not particularly soluble in water and will only diffuse quickly over short distances. Moreover, oxidative metabolism generates acidic products, particularly CO2, and continuous removal of these sources of H+ is essential for the maintenance of life. Marginal failure of either oxygen delivery or hydrogen ion removal will result in illness and tissue damage but total failure of either will end in death within a few minutes. For example, cessation of oxygen supply to the brain leads to a loss of consciousness in 8–10 seconds and permanent brain damage in 5–10 minutes.


As a consequence of these performance requirements we have evolved with a circulatory system which in the textbook person, if stretched out end to end, would measure 60 000 miles or 96 000 km. This is enough to encircle the world three times. This book is about the organization and control of this circulatory system, the causes and effects of failure and the basis for treatment regimens aimed at avoiding or minimizing the effects of circulatory failure. An example of a clinical history of a patient with developing circulatory problems is introduced in Case 1.1:1.


Case 1.1   A design specification for the cardiovascular system: 1


A young man with a history of insulin-dependent diabetes mellitus


Calvin was first diagnosed with diabetes when he was 10 years old. He had initially responded well to the need to comply with his treatment regimen of dietary control and regular doses of insulin given by self-injection. He was familiar with these problems as both his father and grandfather also had diabetes.


However, by the time Calvin reached 18 years old his diabetes did not fit well with his own self-image. He wanted to be out enjoying life with his friends and did not like to feel he was ‘an invalid’. This led to him becoming lax with his medication and his blood glucose control became less rigorous.


There were a number of occasions on which Calvin felt unwell and over a period of 5 years there was a series of eight emergency hospital admissions. On one such occasion he had been drinking more water than usual (polydipsia) and had been producing greater than normal amounts of urine (polyuria) for about 3 weeks. He had become drowsy and lethargic and, for the 3 days prior to the hospital admission, he had been vomiting.


The doctor in the emergency room noted that he was underweight for his age and build. Initial observations included a pulse rate of 142 beats/min, a blood pressure of 100/60 mm Hg and abnormally deep breathing. A venous blood sample provided the following data:


A urine dipstick test also showed the presence of glucose and ketones.


This case history raises the following questions:


Aspects of the answers to these questions are discussed in Case 1.1:2 and in the text of this chapter.


Some fundamental concepts in relation to these opening paragraphs need further explanation.


Oxygen consumption


Our textbook subject at rest consumes about 250 mL O2/min and generates 200 mL CO2/min. This gives rise to the concept of a respiratory quotient (RQ):


image


The precise value for RQ in any individual will reflect the composition of their diet but for a typical person consuming a mixed diet of carbohydrate, fat and protein the RQ would be about 0.8. This means that we normally consume more oxygen than we produce carbon dioxide. During exercise oxygen consumption may increase to about 10 times the resting value and the RQ may move closer to a value of 1 due to preferential metabolism of carbohydrate.


Oxygen is used within the mitochondria of cells to generate adenosine triphosphate (ATP). This provides the energy for movement, for the synthesis of macromolecules and to drive the movement of ions, particularly Na+ ions, across cell membranes against a concentration gradient. The distribution of Na+ and K+ inside and outside cells is summarized in Figure 1.1. The ion gradients are maintained by the sodium pump which expels three Na+ ions and pulls two K+ ions into the cell each time it operates. As both of these ion movements are against a concentration gradient, an ATP molecule is hydrolysed to provide the energy. For some cells there may be about a million sodium pumps each operating at about thirty times a second. In the body as a whole the sodium pump accounts for about 30% of all of our energy intake over our lifetime. In this way, ionic gradients are maintained which are essential for the continuing function of nerves and muscles, including the heart. Failure to maintain ATP generation in hypoxic tissues leads to osmotic swelling of cells and to a loss of normal cellular function (see p.7). To serve all the requirements, the quantities of ATP which must be synthesized are quite prodigious and amount to something roughly equivalent to an individual’s body weight every day.


Diffusion


Diffusion is the movement of particles from an area of high concentration to an area of low concentration. The concentration of a gas in solution is actually the product of the partial pressure and the solubility coefficient (a constant at a given temperature). Two sets of units are in common usage for gas pressures. The appropriate conversion factors are as follows:


image


Some important parameters determining rate of diffusion are:


Most diffusion in living systems takes place in an environment in which water is the solvent, although molecules such as oxygen and carbon dioxide also have to diffuse through the lipid bilayer which makes up cell membranes. Special provision, in the form of transport proteins and ion channels, is made for ions which carry a charge and are therefore not lipid soluble.


Einstein (1905) showed that the time taken for a molecule to diffuse between two points varies as the square of the distance between the points. In physiological terms, diffusion is fine as a process for moving molecules short distances. A typical cell diameter in the body is about 10 μm and the time taken for an oxygen molecule to diffuse this distance would be a few milliseconds. Diffusion of oxygen over longer distances, however, such as the approximately 10 mm (a thousand times 10 μm) thickness of the ventricular wall of the heart, would take a million times as long, a time measured in hours. This would be inconsistent with maintaining life as, given the composition of the atmosphere, the diffusive gradients of oxygen available to us would be too small. The solution to these problems is to have an amazingly profuse circulatory system which delivers the oxygen and other nutrients very close to the cells where they will be used. Cells in the body are rarely more than 50 μm from a capillary and most are not more than 10–20 μm away.


The diffusive gradients concerned with loading of oxygen into pulmonary capillary blood at the lungs and the delivery of oxygen into the tissues are shown in Figures 1.2 and 1.3. Figure 1.2 shows the events at the interface between an alveolus and a pulmonary capillary. A typical Po2 in the alveolus is 13.3 kPa (100 mm Hg). Blood returning to the lungs has a Po2 of about 5.3 kPa (40 mm Hg) and so oxygen diffuses into the pulmonary capillary blood from the alveolus. The diffusive gradient for unloading CO2 at the lungs is much smaller than for O2. Mixed venous blood Pco2 is about 6.1 kPa (46 mm Hg) whilst alveolar Pco2 is typically 5.3 kPa (40 mm Hg). The diffusive gradient for CO2 (0.8 kPa) is 10% of the diffusive gradient for O2 (8 kPa). Both diffuse at about the same rate because CO2 is 20 times as soluble in water as O2. The transit time for red blood cells through pulmonary capillaries at rest is about 1 second but the diffusive exchange of O2 and CO2 is normally complete in about 0.25 seconds.


Delivery of O2 into the tissues (Fig. 1.3) starts with the arterial blood which has picked up O2 in the lungs (Po2 = 13.3 kPa; 100 mm Hg). Oxygen is used inside the mitochondria and the Po2 here is of the order of 0.1 kPa (about 1 mm Hg). The interstitial fluid outside a cell is part of the way down a continuous diffusive gradient between the arterial blood and the inside of a mitochondrion. A typical Po2 in the interstitial fluid is 5.3 kPa (40 mm Hg). Blood leaving a capillary has equilibrated with this fluid and so venous Po2 is the same as in the interstitial fluid.


Carriage of oxygen in blood


A further consequence of the poor solubility of oxygen in water is that we have evolved with an oxygen-carrying pigment, haemoglobin (Hb). The oxygen-binding characteristics of haemoglobin are such that it is nearly fully saturated with oxygen at the partial pressure of oxygen normally present in the alveoli of the lungs. Figure 1.4 shows the oxyhaemoglobin dissociation curve. At a Po2 of 13.3 kPa (100 mm Hg), a typical figure for the alveolus, Hb is 97–98% saturated with O2. This information can be used to calculate the amount of oxygen carried bound to haemoglobin as follows:


image


Typical values for [Hb] are 120 g/L (women), 140 g/L (men). The figure 1.34 mL/g is the volume (mL) of oxygen bound to 1 g Hb when it is fully saturated. These figures mean that arterial blood contains about 200 mL O2 bound to Hb per litre blood. A small amount (0.3 mL/L) is carried as dissolved O2


Reference to the oxyhaemoglobin dissociation curve (Fig. 1.4) shows that venous blood is about 75% saturated with O2 at Po2 = 5.3 kPa (40 mm Hg) and therefore about one quarter of the O2 carried in arterial blood has moved into the tissues. One quarter of the 200 mL O2/L present in arterial blood is 50 mL. If 50 mL of O2 is typically deposited in the tissues from each litre of arterial blood, and the textbook person’s cardiac output (volume of blood pumped per minute from each side of the heart—see Chapter 4) is 5 L/min, then 250 mL O2/min is delivered to the tissues. This is the amount of oxygen identified previously as a figure for O2 consumption rate for the textbook person at rest.


All tissues do not have the same oxygen consumption rate relative to blood flow. The figure quoted above, that ‘venous blood is typically 75% saturated with oxygen’, refers to ‘mixed venous blood’, i.e. the blood in the right side of the heart which is a mixture of all the venous drainages for the whole body. Venous blood from the kidneys, which have a high flow rate but relatively low O2 consumption, has an oxygen saturation of about 90%. By contrast, the blood in the venous drainage from the heart is only 25% saturated with O2. This is an important concept in relation to physiological control mechanisms and to the pathological consequences of disturbances of coronary blood flow (see Chapter 5).


Case 1.1   A design specification for the cardiovascular system: 2


Calvin’s acute circulatory problems


Calvin’s fundamental problem was a lack of insulin, a hormone which moves glucose from the circulation into cells particularly in the liver and skeletal muscle. In addition, in the absence of insulin gluconeogenesis, the conversion of amino acids from the breakdown of protein into glucose is promoted. The high blood [glucose] leads to an osmotic diuresis, excessive urine production and hence body fluid volume depletion. Responses to volume depletion in the form of blood loss (haemorrhage) are discussed in Chapter 14.


The diuresis is the cause of a high [haemoglobin] due to loss of fluid from the extracellular compartment. An appropriate clinical test for volume depletion is to compare standing and lying arterial blood pressure measurements. Normally there will be no substantial difference but in the volume-depleted patient there is a drop in pressure (postural drop) on standing.


In Chapter 4 of this book the links between blood volume and cardiac output (the volume of blood pumped by the heart per minute) are discussed. Basically, the fall in blood volume (a decreased preload on the heart) leads to a decrease in cardiac output and, as a consequence, a fall in arterial blood pressure. The baroreceptor reflex (see Chapter 10) reacts to a fall in blood pressure with an increase in heart rate and constriction of peripheral blood vessels.


Body fluid replacement with a combination of 0.9% saline and 5% glucose is the first priority in order to avoid circulatory collapse. The apparent anomaly of giving extra glucose to a patient with an already high blood [glucose] is explained as follows.


The textbook person contains about 42 L of water. The factors which determine the distribution of this volume between different compartments are described in detail in Chapter 11. Basically, about 14 L is in the extracellular compartment, which includes blood plasma and 28 L is in the intracellular compartment. An increase in the osmotic strength of body fluids, due to high blood [glucose] combined with a decrease in capillary blood pressure associated with volume depletion, means that there is movement of water from the intracellular compartment to the extracellular compartment. As a consequence Calvin suffers both intracellular and extracellular volume depletion. There is a high [Na+] in extracellular fluid and a low [Na+] in the intracellular fluid. Infusion of saline into a patient will therefore selectively expand the extracellular compartment. Administration of 5% glucose solution initially does not substantially change the osmotic strength of body fluids but, once the glucose has become distributed around the body, insulin supplements will drive the glucose into cells where it can be metabolized to CO2 and water. Giving 5% glucose is therefore equivalent to an infusion of pure water and will initially dilute the extracellular compartment. The osmotic gradient created will move water into the intracellular compartment. Infusion of 5% glucose will therefore expand both the intracellular and extracellular compartments. These ideas are explained in more detail in Chapters 11 and 14.


A further potential cause for concern is the increase in plasma [K+]. This is likely to be a result of a ketoacidosis, a form of metabolic acidosis. At a level of 5.5 mmol/L this is not a significant problem, but further increases in potassium as a result of acidosis-induced movement of K+ from inside to outside cells can lead to the development of cardiac arrhythmias and potentially cardiac arrest (see Chapters 2 and 7). Despite a raised plasma [K+] there may be whole body depletion of K+ as most of the K+ is in the intracellular compartment.


The shape and position of the oxyhaemoglobin dissociation curve (Fig. 1.4) shows one of the safety factors in relation to lung function. The top of the curve is nearly flat from 13 kPa (100 mm Hg), normal arterial Po2, down to about 10 kPa (75 mm Hg). This means that a decrease in Po2 within this range makes little difference to the % saturation of haemoglobin with oxygen, that is little change to the total amount of oxygen carried in arterial blood. Put another way, we can afford to have a certain degree of lung malfunction before it makes any significant difference to oxygen delivery to the tissues.


Jun 18, 2016 | Posted by in CARDIOLOGY | Comments Off on A DESIGN SPECIFICATION FOR THE CARDIOVASCULAR SYSTEM

Full access? Get Clinical Tree

Get Clinical Tree app for offline access