18: Atrial Septal Defect with Chronic Thrombus Mimicking CTEPH

../images/1_1_En_18_Chapter/1_1_En_18_Fig1b_HTML.jpg


Figure 18.1

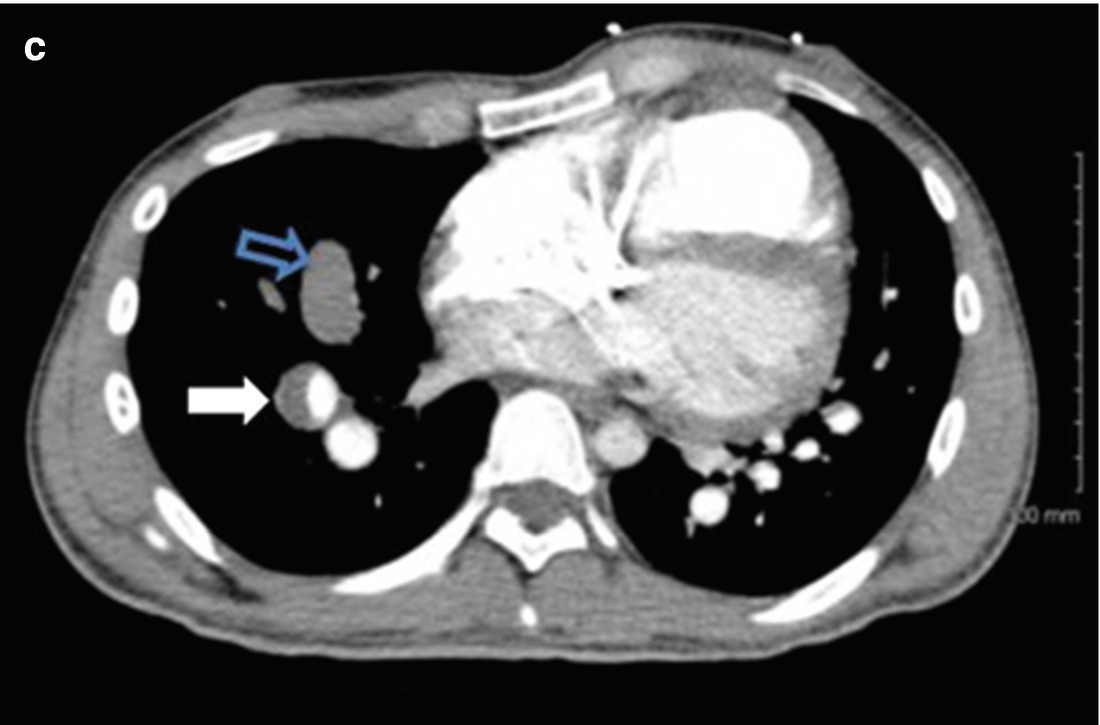
CTA of the chest showing occlusive thrombus in a left upper lobe (panel b, blue arrow) and right middle lobe pulmonary artery (panel c, open blue artery). Eccentric lining thrombus in a markedly enlarged right main PA, and in dilated left upper lobe, right lower lobe segmental vessels also noted (panels a, c, white arrows)


Hospital Course: A chest radiograph (Fig. 18.2) and ventilation- perfusion scan (Fig. 18.3a, b) were performed. The perfusion scan revealed multiple unmatched perfusion defects in the anterior left upper lobe, lateral basal left lower lobe and lateral segment of the right middle lobe. There was uptake of technetium macro aggregated albumin seen in the brain and kidneys consistent with a right-to-left shunt.

../images/1_1_En_18_Chapter/1_1_En_18_Fig2_HTML.jpg

Figure 18.2

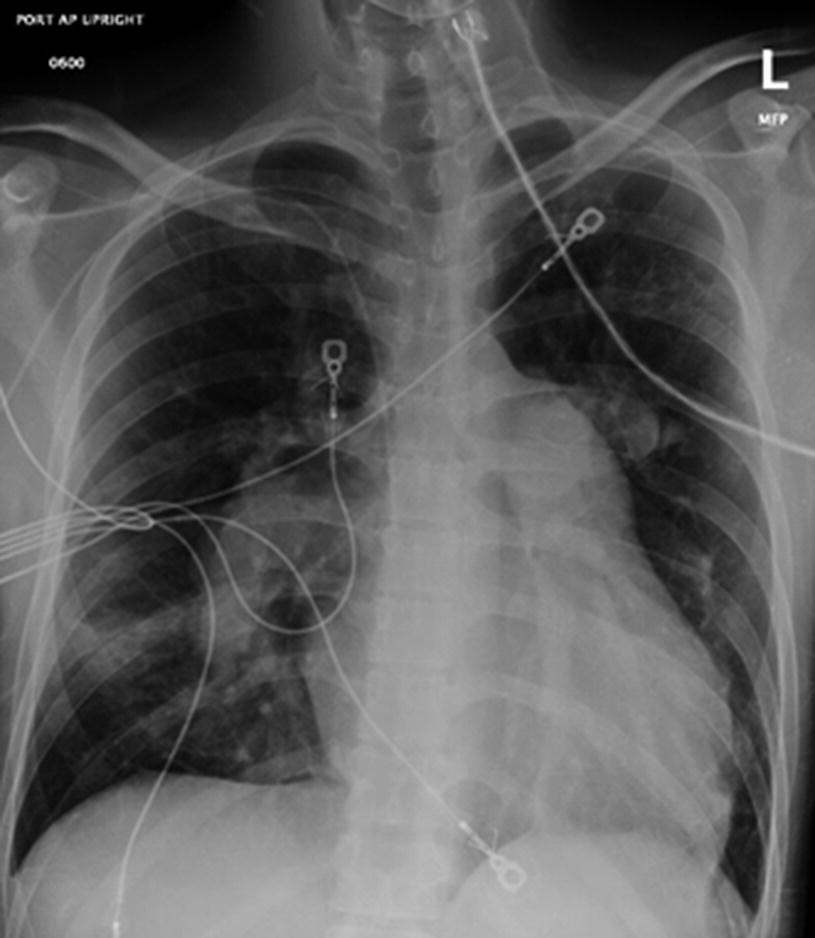
Chest radiography (AP view) demonstrates cardiomegaly with aneurysmal dilatation of the proximal pulmonary arteries. There is no obvious pulmonary artery calcification


../images/1_1_En_18_Chapter/1_1_En_18_Fig3_HTML.png

Figure 18.3

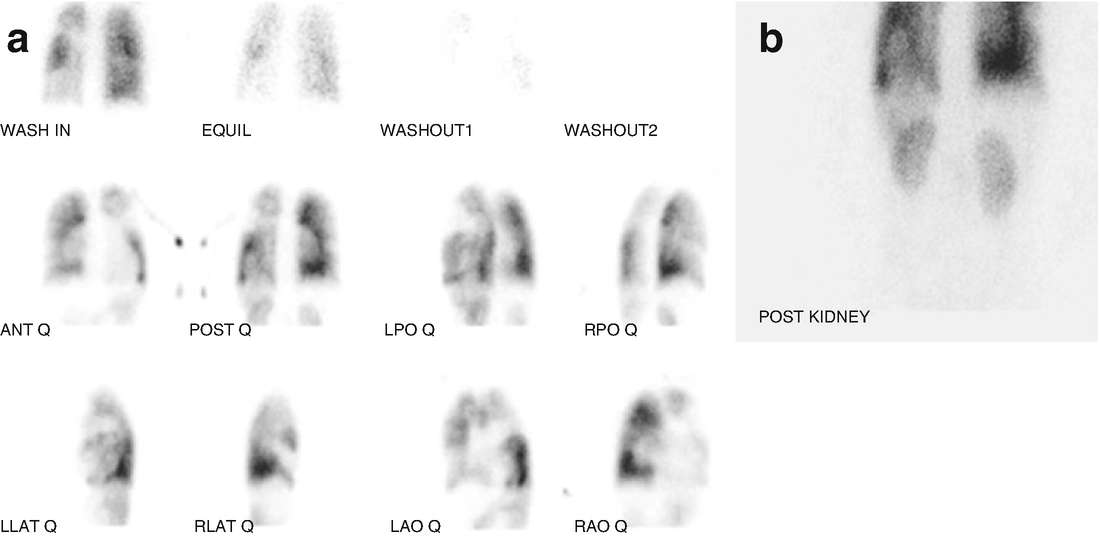
Lung scintigraphy showing unmatched perfusion defects (panel a) as described in the text, with uptake evident in the kidneys suggesting a right to left shunt (panel b)


A repeat transthoracic echocardiogram with agitated saline was ordered and demonstrated a severely enlarged right atrium with early positive bubble study, concerning for an atrial septal defect. The patient underwent right heart catheterization with shunt run with results as follows:


  • Saturation Run: Systemic pulse oximetry 82–84%, high SVC saturation 45%, low SVC saturation 44%, mid RA saturation 62%, IVC saturation 46%, right ventricle saturation 61%, PA saturation 59%.


  • Baseline hemodynamics:


  • Mean right atrial pressure of 2.


  • Right ventricular systolic pressure of 88, right ventricular end-diastolic pressure of 4.


  • Pulmonary artery pressure 92/51, mean pulmonary artery pressure 64.


  • Pulmonary capillary wedge pressure 4.


  • Cardiac output calculations: Qs was equal to 2.17 L/min with cardiac index of 1.4 m−2. Qp was calculated using a few assumed pulmonary venous saturations. Assuming a pulmonary venous saturation of 95%, Qp was equal to 2.36 L/min, 1.5 m−2.


Given the step-up in saturation seen in the right atrium, a cardiac MR was ordered to further assess cardiac anatomy. This revealed total right-sided anomalous pulmonary venous drainage with both the upper and lobe right-sided pulmonary veins draining back into the right atrium (Fig. 18.4). This was associated with mixed atrial septal defects including a sinus venosus defect (Fig. 18.4) and an ostium secundum ASD.

../images/1_1_En_18_Chapter/1_1_En_18_Fig4_HTML.jpg

Figure 18.4

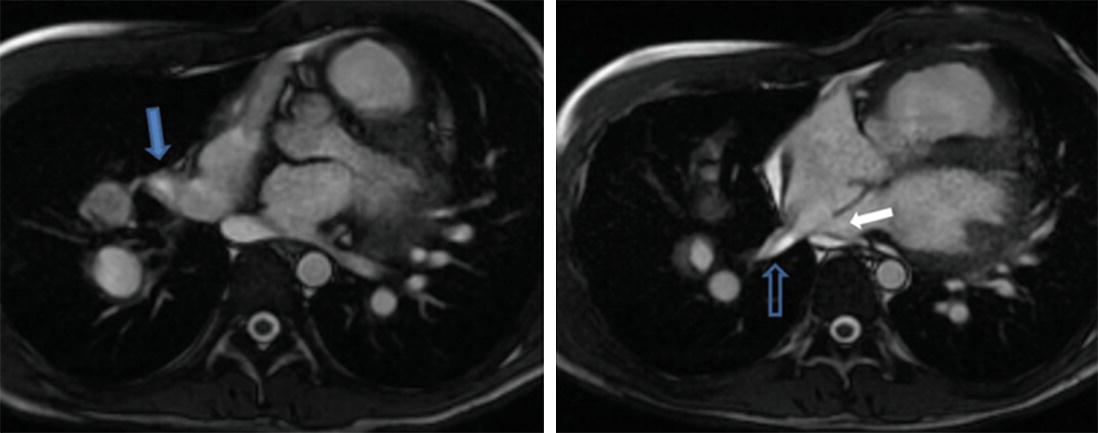
Cardiac magnetic resonance imaging (axial view) depicting right superior (solid blue arrow) and right inferior (open blue arrow) pulmonary veins draining into the right atrium. Sinus venosus defect: white arrow

Only gold members can continue reading. Log In or Register to continue

Stay updated, free articles. Join our Telegram channel

Oct 30, 2020 | Posted by in Uncategorized | Comments Off on 18: Atrial Septal Defect with Chronic Thrombus Mimicking CTEPH

Full access? Get Clinical Tree

Get Clinical Tree app for offline access