Chapter 16
Questions
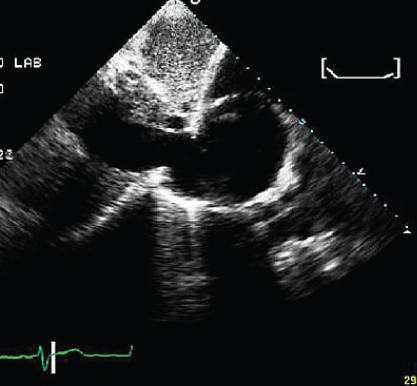
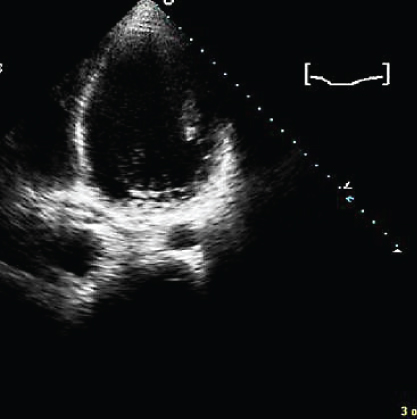
- 301. The parasternal long-axis image of the mitral valve apparatus shows:
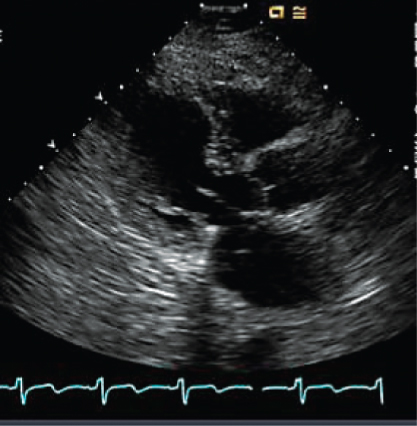
- A. Mitral annular calcification
- B. Rheumatic mitral stenosis
- C. Systolic anterior motion
- D. Annuloplasty ring
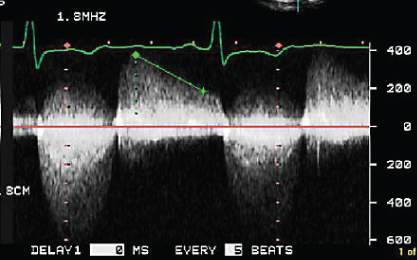
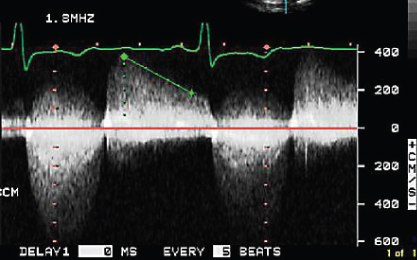
- 302. The continuous wave signal with a peak velocity of 3.2 m/s shown here is indicative of:
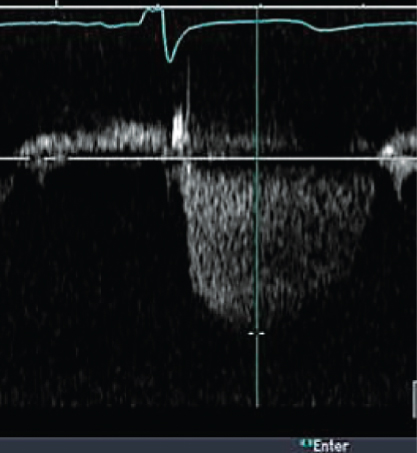
- A. Moderate aortic stenosis
- B. Moderate pulmonary hypertension
- C. Acute severe mitral regurgitation due to papillary muscle rupture
- D. None of the above
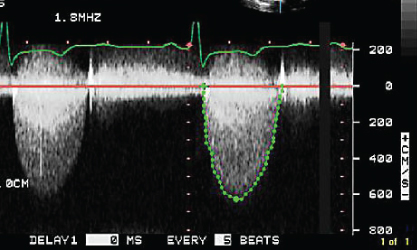
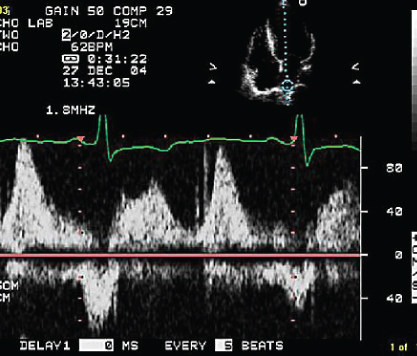
- 303. Assuming a right atrial (RA) pressure of 10 mmHg, the pulmonary regurgitation signal, with an end diastolic velocity of 2.2 m/s shown here is indicative of:
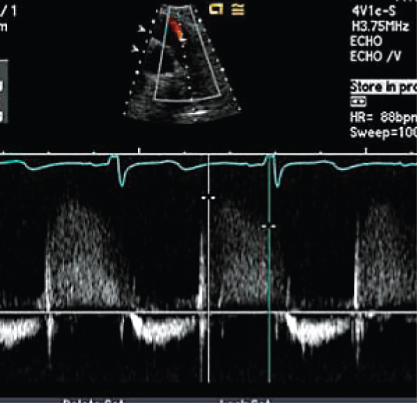
- A. Normal pulmonary artery (PA) pressure
- B. Moderate elevation of PA pressure
- C. Systemic level of PA pressure
- D. None of the above
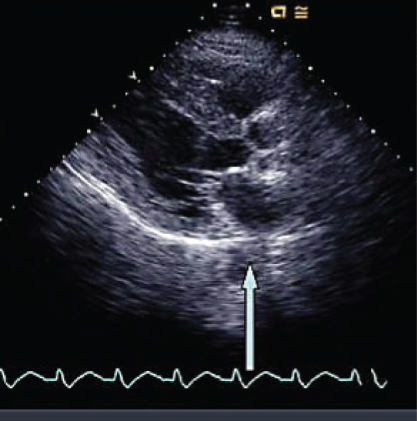
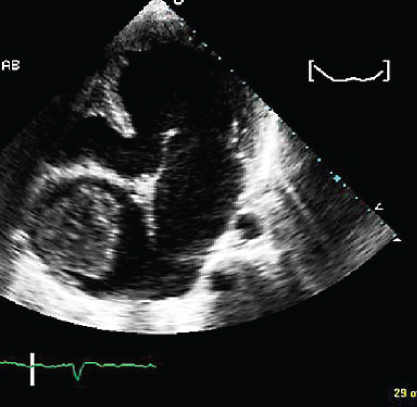
- 304. The abnormalities shown in this image include:
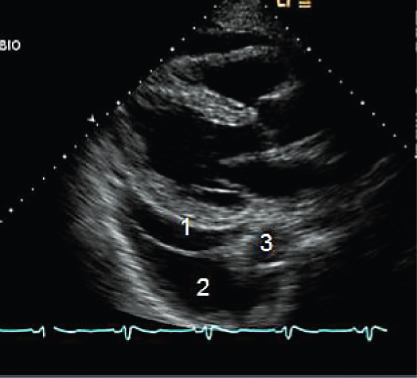
- A. Pericardial effusion
- B. Left pleural effusion
- C. Left pleural effusion and pericardial effusion
- D. Abnormally thick pericardium
- 305. The pattern of aortic valve opening in this patient is likely to be due to:
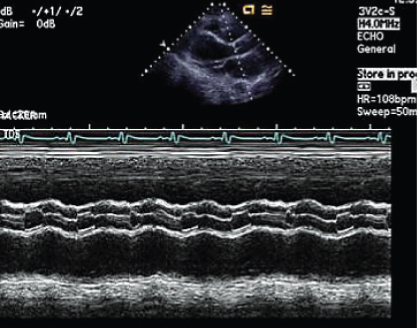
- A. Hypertrophic obstructive cardiomyopathy (HOCM)
- B. Pulsus alternans
- C. Intra-aortic balloon pump (IABP) with 1:3 support
- D. Left ventricular assist device (LVAD) with 1:3 support
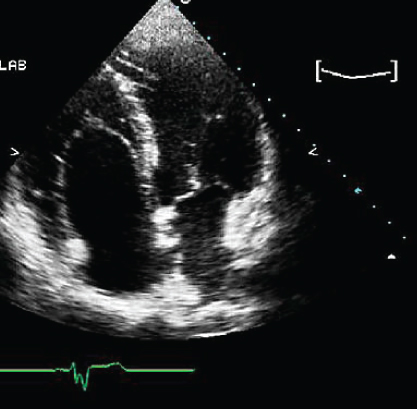
- 306. This is an apical four-chamber view of the left ventricle (LV). The structure indicated by the arrow in the LV apex is likely to be:
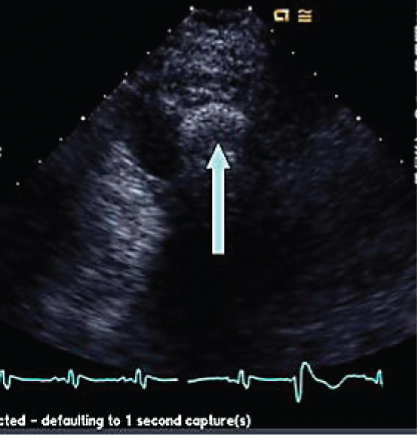
- A. LV thrombus
- B. Rib artifact
- C. Cannula of LVAD
- D. False tendon in the LV apex
- 307. The structure indicated by the arrow is:
- A. Descending thoracic aorta
- B. Coronary sinus
- C. Left lower pulmonary vein
- D. Left PA
- B. Coronary sinus
- 308. The transthoracic image shown here is indicative of:
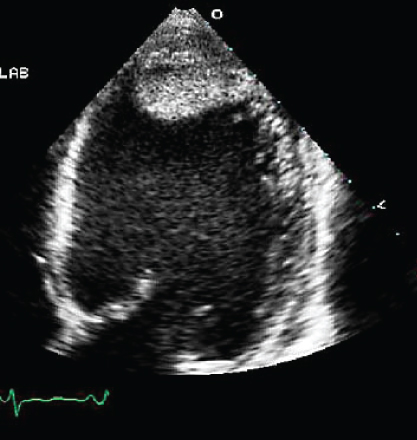
- A. LV apical thrombus
- B. Moderator band
- C. Rib artifact
- D. Ventricular noncompaction
- 309. The patient shown here is likely to have:
- A. Heart failure
- B. Intravascular volume depletion with hypotension
- C. Right atrial tumor
- D. None of the above
- B. Intravascular volume depletion with hypotension
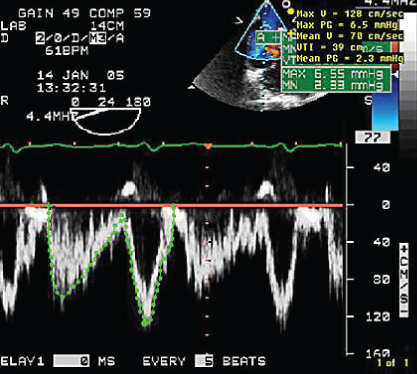
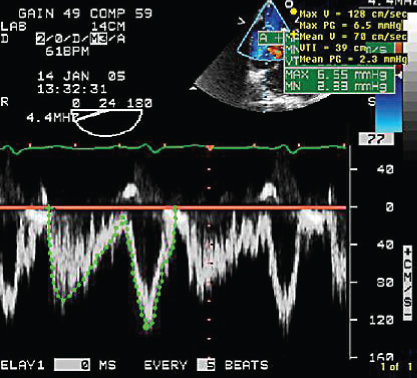
- 310. The continuous wave Doppler signal shown here is suggestive of:
- A. Mixed mitral valve disease with significant mitral stenosis (MS) and mitral regurgitation (MR)
- B. Mixed aortic valve disease with significant aortic stenosis (AS) and aortic regurgitation (AR)
- C. Combination of AR and MR
- D. Ventricular septal defect (VSD) with bidirectional flow
- 311. This patient is likely to have (BP 130/65 mmHg):
- A. High left ventricular end diastolic pressure (LVEDP)
- B. Diastolic MR
- C. Premature mitral valve closure
- D. All of the above
- 312. The following statements are true of the Doppler signal shown here:
- A. The patient may have severe valvular aortic stenosis
- B. The patient may have severe systolic anterior motion (SAM)
- C. Patient may have severe MR
- D. None of the above
- 313. The pulmonary vein flow pattern is indicative of:
- A. Volume depletion
- B. Atrial fibrillation
- C. Elevated LVEDP with normal left atrial (LA) pressure
- D. Elevated LVEDP with high LA pressure
- 314. This patient has:
- A. Tricuspid atresia
- B. Right atrial myxoma
- C. Hydatid cyst of the heart
- D. Hypoplastic left heart syndrome
- 315. The flow shown here is consistent with:
- A. Superior vena cava (SVC) flow
- B. Pulmonary vein flow
- C. Atrial septal defect (ASD) flow
- D. None of the above
- 316. This patient had secundum ASD fairly circular with a diameter of 2 cm. The heart rate was 61/min. The approximate shunt flow would be:
- A. 5 L/min
- B. 7.4 L/min
- C. 13 L/min
- D. 20 L/min
- 317. The abnormality shown in this image could be associated with:
- A. Accessory pathway
- B. Atrial septal defect
- C. Tricuspid regurgitation
- D. All of the above
- 318. The patient shown here has:

Stay updated, free articles. Join our Telegram channel
- A. Mitral annular calcification

Full access? Get Clinical Tree


