14: Sarcoidosis and Large Vessel Pulmonary Vascular Disease—Another CTEPH Mimic
Figure 14.1
PA chest radiograph demonstrating normal heart size, symmetric hilar fullness, in the absence of significant parenchymal abnormalities
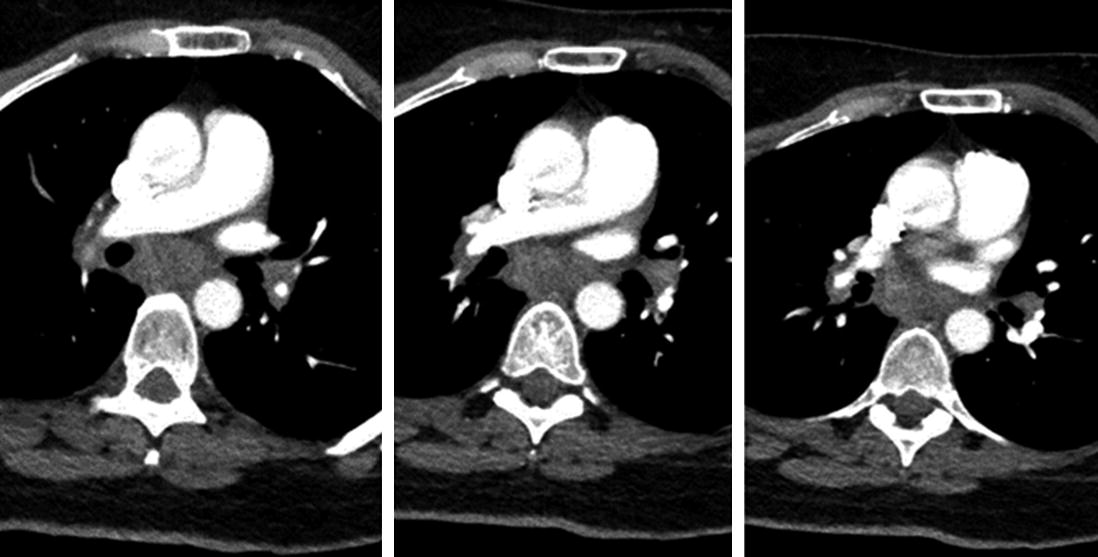
CT angiogram of chest was then requested demonstrating diffuse mediastinal and hilar “soft tissue fullness” consistent with matted adenopathy was described; multifocal parenchymal opacities were again demonstrated and there was no evidence for acute pulmonary emboli (Fig. 14.2).
Figure 14.2
Extensive soft tissue in the subcarinal space and surrounding the proximal pulmonary vessels
Pulmonary function tests in April 2018: FVC 2.65 L (78%), FEV-1 2.20 L (81%), FEV-1/FVC ratio 83% with DLCO 18.65 (82% predicted).
Ongoing investigation of the patient’s symptoms prompted a right heart catheterization in May 2018. Resting pulmonary hemodynamics showed RA mean 3, PAp 39/12 mmHg with a mean pressure of 22 mmHg. Fick cardiac output 5.2 L/min with a cardiac index 3.0 L/min/m2; PVR was 3.25 Wood units. A level 3 cardiopulmonary stress test later that same month included rest and exercise pulmonary hemodynamics and full gas exchange. A borderline elevated PA pressure at rest (40/18 mmHg, mean pressure of 25 mmHg) showing a dramatic rise with exertion to 90/35 mmHg, 53 mmHg mean (Table 14.1).
Table 14.1
Summary of level 3 cardiopulmonary exercise testing
Rest
Peak VO2
RAP
3
8
PAP (systolic/diastolic/mean)
40/18/25
90/35/53
CO/CI
3.7/2.1
9.3/5.3
PAOP
9
14
HR
70
163
BP
116/64
150/90
SpO2
100%
100%
Only gold members can continue reading. Log In or Register to continue