Hemodynamic monitoring

Arterial blood pressure monitoring
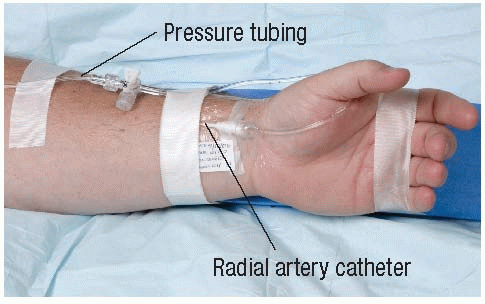
Hemodynamic monitoring is used to assess cardiac function and deter mine the effectiveness of therapy. In arterial blood pressure monitoring, a doctor inserts a catheter into the patient’s radial or femoral artery to measure systolic, diastolic, and mean pressures or to obtain samples Radial artery catheter for ABG studies. A transducer transforms the flow of blood during systole and diastole into a waveform, which appears on a monitor screen.
|
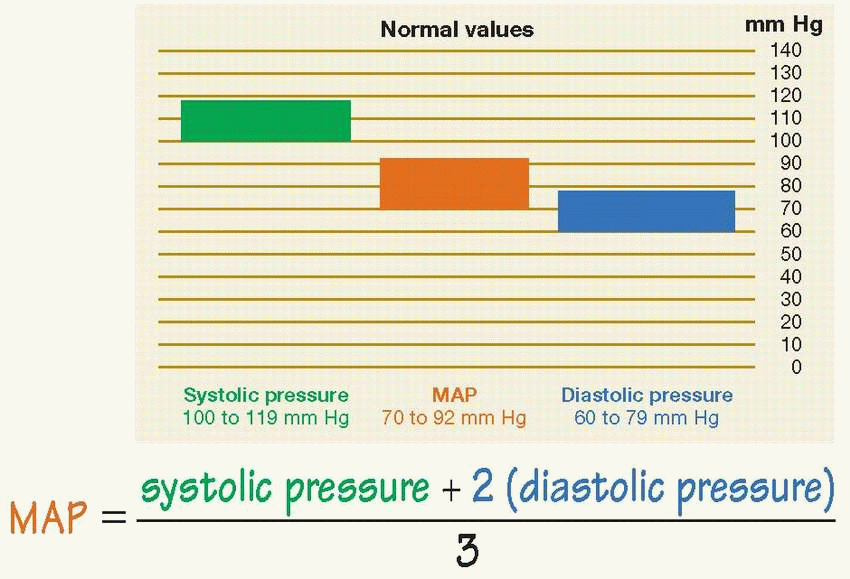
Normal arterial pressure parameters
In general, arterial systolic pressure reflects the peak pressure generated by the left ventricle. It also indicates compliance of the large arteries, or the peripheral resistance.
Arterial diastolic pressure reflects the runoff velocity and elasticity of the arterial system, particularly the arterioles.
Mean arterial pressure (MAP) is the average pressure in the arterial system during systole and diastole. It reflects the driving, or perfusion, pressure and is determined by arterial blood volume and blood vessel elasticity and resistance.
|
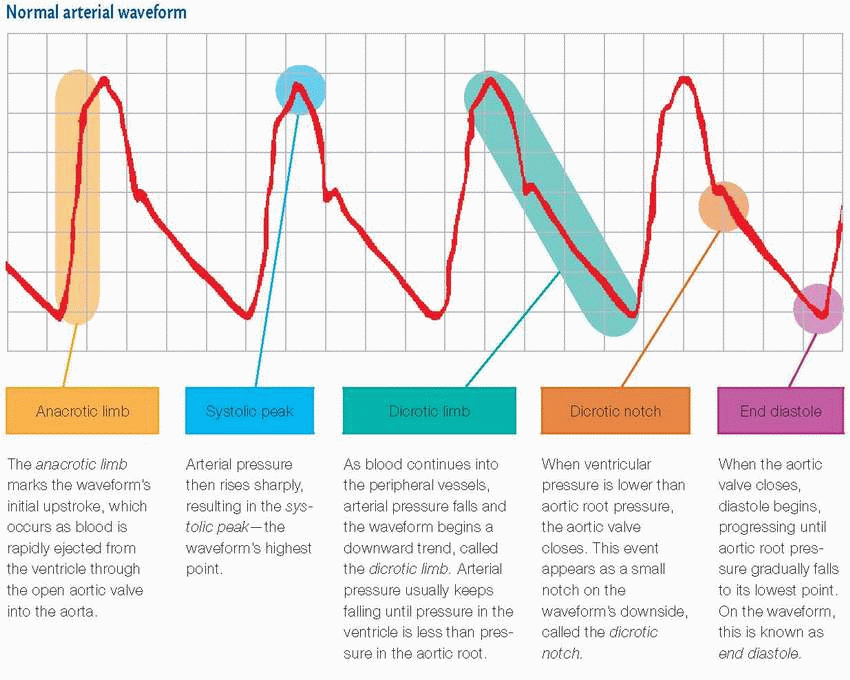
Arterial waveform configuration
Normal arterial blood pressure produces a characteristic waveform, representing ventricular systole and diastole. The waveform has five distinct components, as shown below.
|
|
Recognizing abnormal waveforms
Understanding a normal arterial waveform is relatively straightforward. Unfortunately, an abnormal waveform isn’t so easy to decipher. Abnormal patterns and markings, however, may provide important diagnostic clues to the patient’s cardiovascular status, or they may simply signal trouble in the monitor. Use this chart to help you recognize waveform abnormalities. Always check the patient when an abnormal waveform is noted.
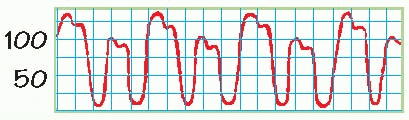
Waveform | Abnormality | Possible causes |
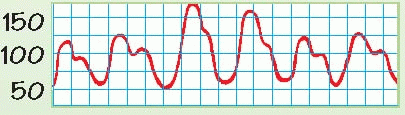
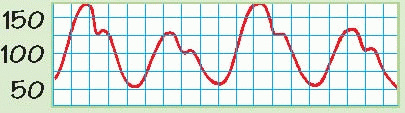
| Alternating high and low waves in a regular pattern | Ventricular or supraventricular bigeminy |
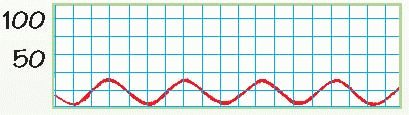
| Flattened waveform | Overdamped waveform or hypotensive patient |
| Slightly rounded waveform with consistent variations in systolic height | Patient on ventilator with positive endexpiratory pressure |
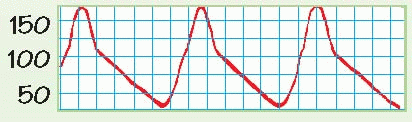
| Slow upstroke | Aortic stenosis or poor systolic contractility |
| Diminished amplitude on inspiration | Pulsus paradoxus, possibly from cardiac tamponade, constrictive pericarditis, or lung disease |
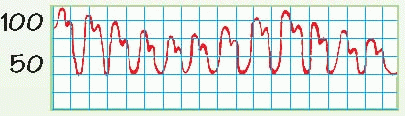
| Alteration in beat-to-beat amplitude (in otherwise normal rhythm) | Pulsus alternans, which may indicate left ventricular failure |
|

|

Pulmonary artery pressure monitoring
Continuous pulmonary artery pressure (PAP) and intermittent pulmonary artery wedge pressure (PAWP) measurements provide important information about left ventricular function and preload.
|

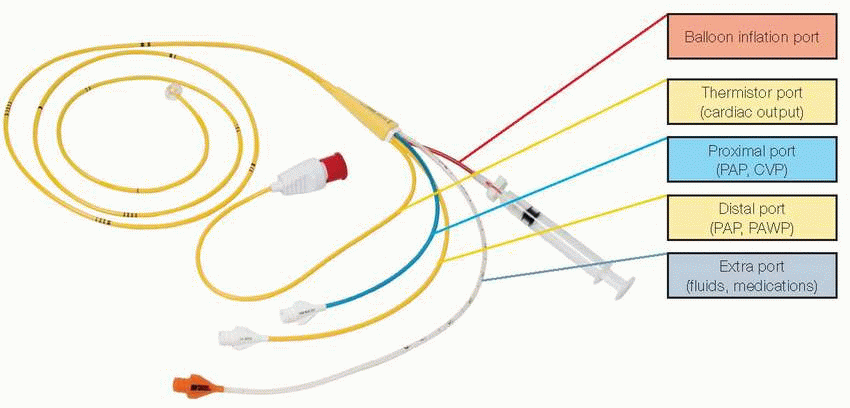
PA catheter
As shown here, a pulmonary artery (PA) catheter contains several lumens. Each lumen has its own purpose (indicated in parentheses).
|
Stay updated, free articles. Join our Telegram channel

Full access? Get Clinical Tree


