P
Patient population
Describes the patient population being targeted by the intervention (e.g., patients with Barrett’s esophagus)
I
Intervention
Describes the intervention that is being studied (e.g., minimally invasive esophagectomy for Barrett’s esophagus with high grade dysplasia)
C
Comparator
Describes the intervention to which the study intervention is being compared to (e.g., radio frequency ablation)
O
Outcomes
Describes the outcomes which includes benefits and downsides (e.g., all-cause mortality, progression to esophageal adenocarcinoma, quality of life)
What Outcomes Should We Consider for Clinical Decision Making?
Not all outcomes are equally important. Clinical questions in practice guidelines often contain several outcomes, some of which may or may not be useful for decision making. GRADE categorizes outcomes in a hierarchical fashion by listing outcomes that are critical to decision making (such as mortality), outcomes that are important but not critical for decision making (post-thoracotomy pain syndrome) and outcomes that are less important (hypertrophic scar resulting from thoracotomy incision). Such a step-wise rating is important because in GRADE, unlike other guideline systems that rate individual studies, quality of the available evidence is rated for individual outcomes across studies (Fig. 2.1). The reasoning behind this is that quality frequently differs across outcomes, even within a single study.
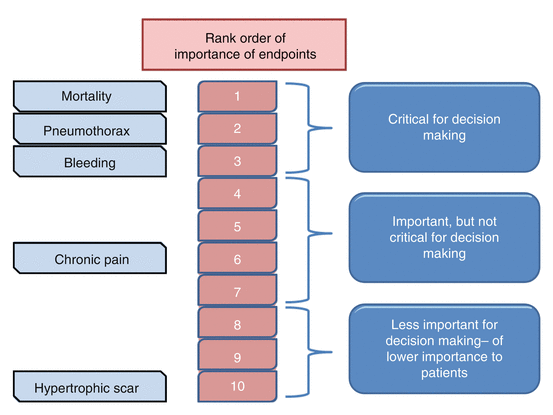
Fig. 2.1
Illustration of ranking outcomes according to importance to patients for assessing benefits and risks of open thoracotomy
Guideline panels should specify the comparator explicitly. In particular, when multiple treatment options are involved (such as surgical vs. nonsurgical treatments for symptomatic giant bullae in COPD), it should be specified whether the recommendation is suggesting that all treatments are equally recommended or that some interventions are recommended over others. In the same context, the choice of setting (such as resource poor vs. adequate resources or high volume vs. low volume centers) needs to be taken into consideration. Guideline panels should be aware of the audience and the setting they are targeting when formulating guidelines. We will elaborate further on resource use later in this chapter.
Grading the Quality of Evidence
The quality of evidence is the extent to which our confidence in a comparative estimate of an intervention effect is adequate to support a particular recommendation. For the rest of the chapter we will therefore use the terms “confidence in the evidence” and “quality of evidence” interchangeably.
Following the formulation of a PICO based clinical question is the crucial process of reviewing and grading the quality of evidence associated with the clinical question. For instance, a question like ‘surgical management of non-small cell lung cancer’ might give us a large number of studies, which might include randomized clinical trials (RCTs), observational studies and case series conducted in different settings, involve various kinds of surgeries and target different patient populations. Indeed, this becomes a challenge for review authors and guideline developers alike as they are presented with an enormous body of evidence. GRADE offers a formal way of rating the quality of this large body of evidence by providing detailed guidance for authors of systematic reviews and guidelines. GRADE defines the quality of evidence as the confidence we have in the estimate of effect (benefit or risk) to support a particular decision [6]. Although confidence in the evidence is continuous, GRADE uses four distinct categories to conceptualize evidence quality (Table 2.2).
Table 2.2
Quality of evidence
High quality | We are very confident that the true effect lies close to that of the estimate of the effect |
Moderate quality | We are moderately confident in the estimate of effect: The true effect is likely to be close to the estimate of effect, but possibility to be substantially different |
Low quality | Our confidence in the effect is limited: The true effect may be substantially different from the estimate of the effect |
Very low quality | We have very little confidence in the effect estimate: The true effect is likely to be substantially different from the estimate of effect |
Rating the Quality of Evidence from Randomized Controlled Trials
In GRADE, outcomes that are informed from RCTs start as high quality evidence. However, RCTs vary widely in quality. Methodological limitations (risk of bias), particularly related to the design and execution of RCTs can often lower the quality of evidence for a particular outcome. GRADE uses five different, well defined criteria to rate down the quality of evidence from RCTs (Table 2.3).
Table 2.3
Rating the quality of evidence for each important outcome
For outcomes informed by RCTs, start as high confidence, then rate down to moderate, low or very low confidence in the evidence | |
For outcomes informed by observational studies, start as low confidence, then either rate down or, on rare occasions, rate up to moderate or high confidence in the evidence | |
Checklist | Things to look out for |
Risk of bias | RCTs: major limitations, such as lack of allocation concealment, lack of blinding, large losses of follow-up, failure of intention-to-treat analysis, and a study terminated early for benefit. Consider using the Cochrane risk of bias tool [7] |
Observational studies: assess risk of confounding by examining the selection of exposed and non-exposed cohort, comparability of the cohort and issues with assessment and adequacy of follow-up of the outcomes of interest. Consider using the Newcastle-Ottawa quality assessment tool [8] | |
Inconsistency | Widely differing estimates of the treatment effect (variability in results or heterogeneity) |
Indirectness | Population: e.g., differences in age, gender, comorbidities |
Intervention: e.g., similar but not identical intervention | |
Comparator: e.g., difference in comparator intervention | |
Outcomes: e.g., use of surrogate outcomes, short-term vs. long-term | |
No head-to-head comparison of two interventions | |
Imprecision | Wide confidence intervals/small sample size/few events that make the result uninformative |
Publication bias | High probability of failure to report studies (likely because no effect was observed) |
Magnitude of effect | Large magnitude of association: RR >2.0 or RR <0.5 |
Very large magnitude of association: RR >5.0 or RR <0.2 | |
Two or more observational studies, direct evidence, no plausible confounders, no threats to validity, sufficiently precise estimate | |
Dose-response | Presence of a dose-response gradient |
Plausible confounders | Unaccounted, plausible biases from observational evidence that moves the result in the direction of underestimating the apparent treatment effect (all plausible confounding would reduce a demonstrated effect; all plausible confounding would suggest a spurious effect when results show no effect) |
Limitations in Study Design
Proper randomization and adequate allocation concealment, which prevents clinicians and participants becoming aware of upcoming assignments are important strategies to protect from bias. Inadequate allocation concealment leads to exaggerated estimates of treatment effect [9]. Major limitations in study design may lead to rating down the quality of evidence for an outcome. However, assessment of whether or not a methodological shortcoming, such as lack of blinding, may have had a substantial impact on an estimate of effect is important as there are situations where lack of blinding may not materially impact a particular outcome. Another issue that is commonly encountered with RCTs is losses to follow up. Again, losses to follow up may not always require rating down if there are few and proportionate losses to follow up in both treatment and control groups. However, disproportionate losses to follow up can either increase (due to greater losses in the control group) or decrease (due to greater losses in the treatment group) the treatment effect [10]. The way in which RCTs are analyzed is another important criterion to consider in study design. Intention-to-treat (ITT) analysis is the preferred method of analysis of RCTs. However, it is documented that the intention-to-treat approach is often inadequately described and inadequately applied in RCT and deviations from ITT analysis are common [11]. RCTs should be carefully reviewed to determine if they adopted the ITT approach for a particular outcome. Lastly, authors of systematic reviews and guideline developers should exercise caution when they encounter trials that are stopped early for benefit, particularly when such trials contribute considerable weight to a meta-analysis as they might produce a spurious improvement in the treatment effect [12, 13].
Inconsistency of Study Results
Confidence in the estimate of effect may require rating down for inconsistency, if the magnitude and direction of effects across different studies varies widely (heterogeneity of study results). Variability in treatment effects across studies usually is the result of varying populations or interventions. However, when the reasons for inconsistency across studies cannot be identified, the confidence in the evidence may be lower. Consider for example the effect of suction vs. non-suction on prolonged air leakage to the underwater seal drains following pulmonary surgery. A meta-analysis of available RCTs showed varying effect estimates and direction of effect resulting in an I-squared of residual heterogeneity of close to 60 %, which could be considered substantial and it would not be unreasonable to rate down for inconsistency (Fig. 2.2) [14].
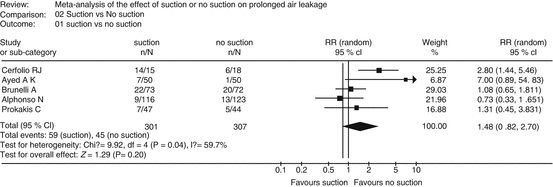
Fig. 2.2
Effect of suction vs. non-suction on prolonged air leakage showing widely varying estimate of effects and substantial heterogeneity among studies (I-squared of ~60 %) (Reprinted from Deng et al. [12], with permission)
It is particularly important to remember that in GRADE, the quality of evidence is not rated up for consistency, it is only rated down for inconsistency. Several criteria may help decide whether heterogeneity exists: the point estimates vary widely across studies; minimally or non-overlapping confidence intervals; statistical test for heterogeneity shows a low p-value; I-squared value (percentage of variability due to heterogeneity rather than chance) is large [15].
Indirectness of Evidence
GRADE defines several sources of indirectness. For example, differences in patient characteristics (age, gender and race), differences in interventions or comparators (similar but not the same intervention or comparators), indirectness of outcomes (direct outcome measures vs. surrogate outcome measures) and indirect comparisons (e.g., lack of head-to-head trials of competing surgical approaches). All sources of indirectness can result in lowering our confidence in the estimate of effects. However, it is necessary to remember that when direct evidence is limited in quantity or quality, indirect evidence from other populations may be considered and the quality need not necessarily be rated down with proper justification for not doing so. For example, although direct evidence about the safety and effectiveness of prophylaxis of VTE prevention in patients undergoing thoracic surgery is limited, the ACCP anti-thrombotic guidelines did not rate down for indirectness as they felt that the evidence about relative risks from studies of patients undergoing general or abdominal-pelvic surgery could be applied with little or no indirectness to thoracic surgery [16]. Another domain of indirectness is duration of follow-up for certain outcomes. GRADE recommends that guideline developers should always indicate the length of follow up to which the estimate of absolute effect refers. This length of follow up is a time frame judged appropriate to balance the risk-benefit consequences of alternative treatment strategies. Longer follow up periods are associated with higher risk differences between intervention and control. This could potentially lead to important differences in readers’ perception of the apparent magnitude of effect. Often, extending the time frame involves the assumption that event rates will stay constant over time [17].
Of particular importance is the categorization of outcome measures into direct and surrogate outcomes. In the absence of data on patient-important outcomes, surrogates could contribute to the estimation of the effect of an intervention on the outcomes that are important. Post-surgical asymptomatic deep vein thrombosis detected by screening venography or ultrasound surveillance is an example of a surrogate outcome [18]. It is to be noted that despite the relative importance of direct outcomes, both direct and surrogate outcomes should be reported in studies because the audience for guideline developers and systematic reviews might want to see both before making appropriate decisions.
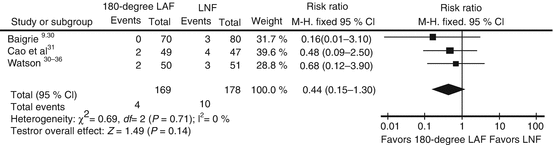
Imprecision
Imprecision is usually determined by examining the confidence intervals. Usually, studies with few enrolled patients and/or few events have wider confidence intervals. Additionally, our confidence in the evidence is lowered when the 95 % confidence interval fails to exclude important benefit or important harm. Consider for example the long-term outcome of dilation requirements when using 180-degree laparoscopic anterior fundoplication (180-degree LAF) versus laparoscopic Nissen fundoplication (LNF) for GERD [19]. Although the partial fundoplication showed less than half the rate of dilatations, few events in the studies and generally low sample sizes did not allow for a precise estimate even after pooling the results, and the 95 % confidence interval crosses one (Fig. 2.3).