CHAPTER 6 Frederick M. Costello and George A. Stouffer A key component of evaluating the hemodynamic status of a patient is a measurement of cardiac output. Cardiac output is the amount of blood moved per unit time from the venous system (i.e., the vena cava) to the arterial system (i.e., aorta). It is a dynamic process and tightly regulated so that the blood flow through the heart equals the perfusion needs of the body. Cardiac output is primarily regulated by preload, afterload, heart rate, and myocardial contractility. Many factors have rapid effects on cardiac output, including metabolic demands, posture, volume status, adrenergic state, and respiratory rate (e.g., cardiac output increases with inhalation and decreases with exhalation or the Valsalva maneuver). Cardiac output decreases with age [1] and increases with exercise. For example, cardiac output can increase up to sixfold with exercise in trained athletes; oxygen extraction also increases with exercise and thus oxygen delivery to tissues can increase twelvefold to eighteenfold. Cardiac index is the cardiac output divided by the body surface area. A cardiac index <1 L/min/m2 is generally incompatible with life. Cardiac output is a measurement of the forward flow of blood in the vascular system and is equal to the heart rate × ventricular stroke volume (in the absence of valvular regurgitation). Measurement of the heart rate is easily attainable, but an accurate measurement of stroke volume is more challenging (see Table 6.1). Because of the difficulty in measuring left ventricular stroke volume, several methods have been developed that calculate blood flow through the right heart. In the cardiac catheterization laboratory or in the intensive care unit, cardiac output is primarily measured using either the Fick method or the indicator dilution method (e.g., thermodilution). Each of these techniques has advantages and pitfalls that are discussed in detail in this chapter (see Table 6.2). Table 6.1 Important formulas involving cardiac output. Table 6.2 Comparison of Fick and thermodilution methods of determining cardiac output. In 1870, Adolph Fick described the first method to estimate cardiac output in humans. He postulated that oxygen uptake in the lungs is entirely transferred to the blood and therefore that cardiac output can be calculated knowing the oxygen consumption of the body and the difference in oxygen content between arterial and mixed venous blood. Cardiac output can be calculated using the Fick method knowing the oxygen saturation of arterial and mixed venous blood, the hemoglobin concentration, and the oxygen consumption based on this equation: The constant 1.36 is expressed in mL O2/g hemoglobin.
Cardiac output
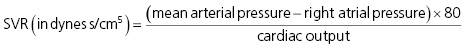
where SVR = systemic vascular resistance. Normal SVR = 700–1600 dynes s/cm5
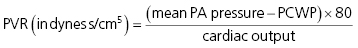
where PA = pulmonary artery, PCWP = pulmonary capillary wedge pressure, and PVR = pulmonary vascular resistance. Normal PVR = 20–130 dynes s/cm5

where CO = cardiac output, SV = stroke volume, and HR = heart rate
Fick
Thermodilution
Underlying principle
Fick principle (conservation of mass): the uptake or release of a substance by an organ is the product of blood flow to the organ × difference in the concentration of the substance between blood entering and blood leaving the organ
Conservation of energy: that is, that there is no loss of cold injectate between the site of injection and detection
Other underlying assumptions are that mixing of the indicator and blood is complete and that the temperature change elicited by injection of saline can be discriminated accurately from the fluctuations in baseline temperature in the pulmonary artery
Sources of error
Determination of oxygen saturations
Warming of injectate during transit through catheter
Assumption of steady state
Irregular heart rates
Assumed oxygen consumption values
Tricuspid regurgitation
Temperature of blood in PA varies with respiratory and cardiac cycles
Advantages
More accurate than TD in low output states, tricuspid regurgitation, and irregular heart rates
More accurate than Fick in high output states
Variation under ideal conditions
10% when measuring oxygen consumption
5–20%
Fick method

Stay updated, free articles. Join our Telegram channel

Full access? Get Clinical Tree


